View and analyze risk score data
Serverless Security Stack
The Elastic Security app provides several ways to monitor the change in the risk posture of entities in your environment.
After reviewing an entity’s risk score, the recommended next step is to investigate the risky entity in Timeline.
In the Entity Analytics overview, you can view entity key performance indicators (KPIs), risk scores, and levels. You can also click the number link in the Alerts column to investigate and analyze the alerts on the Alerts page.
If you have enabled the entity store, you'll also get access to the Entities section, where you can view all hosts, users, and services along with their risk and asset criticality data.
Access the Entity Analytics overview from the following pages:
- Stack Serverless Entity analytics
- Entity analytics dashboard
You can prioritize alert triaging to analyze alerts associated with risky or business-critical entities using the following features in the Elastic Security app.
Use the Alerts table to investigate and analyze:
- Host, user, and service risk levels
- Host, user, and service risk scores
- Asset criticality
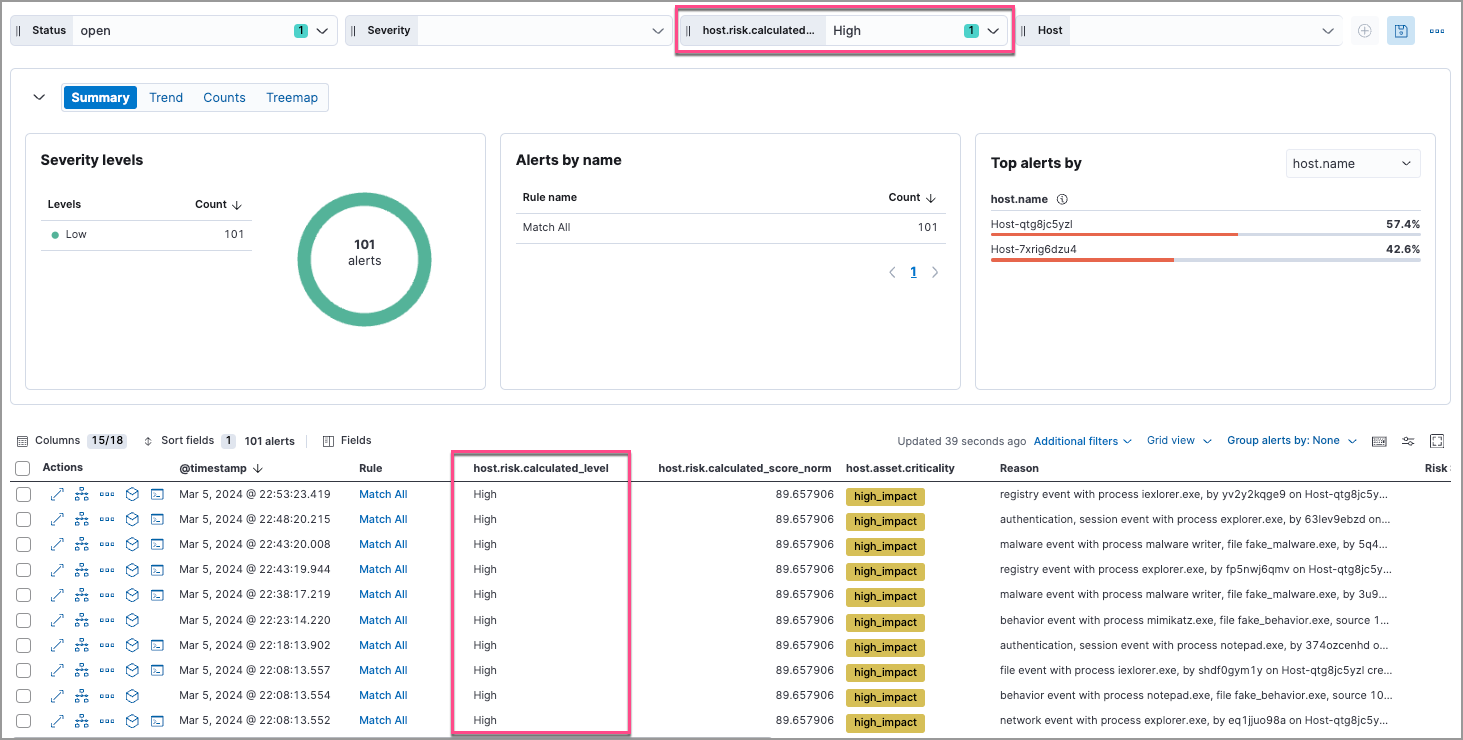
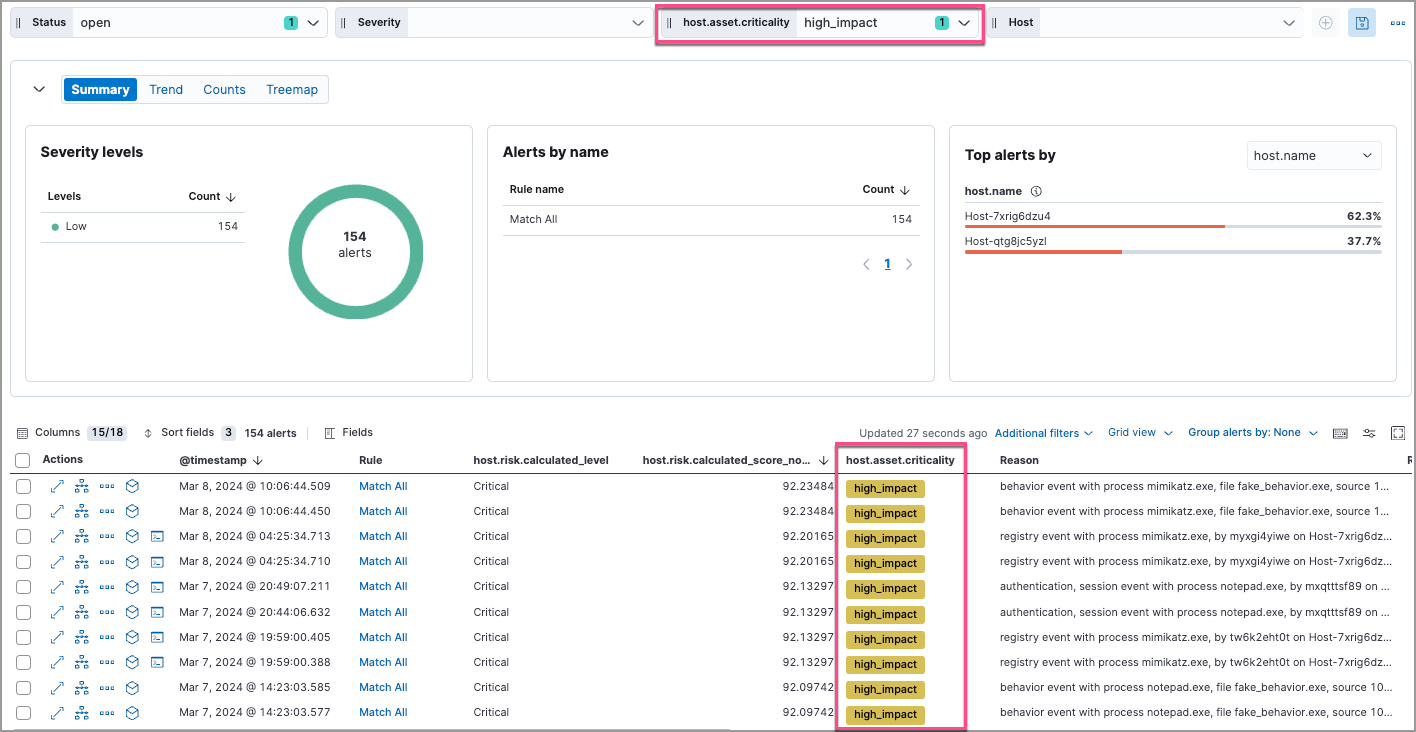
To display entity risk score and asset criticality data in the Alerts table, select Fields, and add the following:
user.risk.calculated_level,host.risk.calculated_level, orservice.risk.calculated_leveluser.risk.calculated_score_norm,host.risk.calculated_score_norm, orservice.risk.calculated_score_normuser.asset.criticality,host.asset.criticality, orservice.asset.criticality
Learn more about customizing the Alerts table.

To analyze alerts associated with high-risk or business-critical entities, you can filter or group them by entity risk level or asset criticality level.
If you change the entity’s criticality level after an alert is generated, that alert document will include the original criticality level and will not reflect the new criticality level.
Use the drop-down filter controls to filter alerts by entity risk level or asset criticality level. To do this, edit the default controls to filter by:
To group alerts by entity risk level or asset criticality level, select Group alerts by, then select Custom field and search for:
host.risk.calculated_level,user.risk.calculated_level, orservice.risk.calculated_levelfor entity risk level: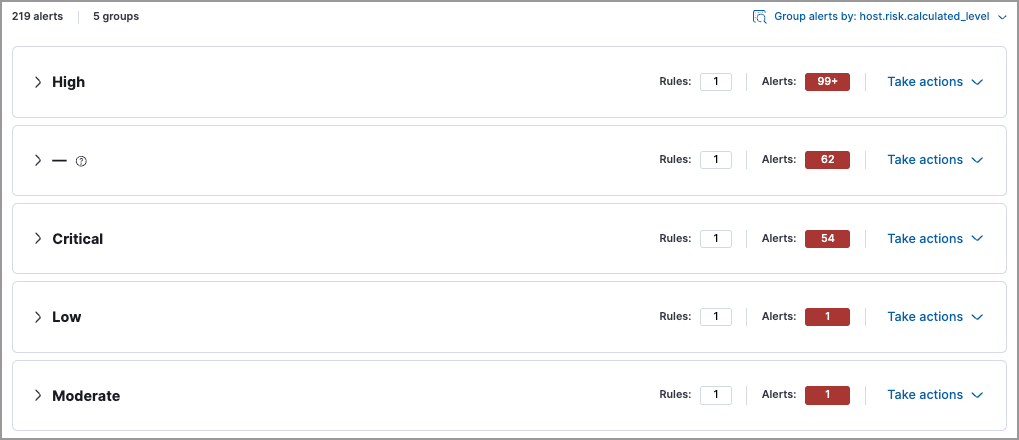
host.asset.criticality,user.asset.criticality, orservice.asset.criticalityfor asset criticality level:
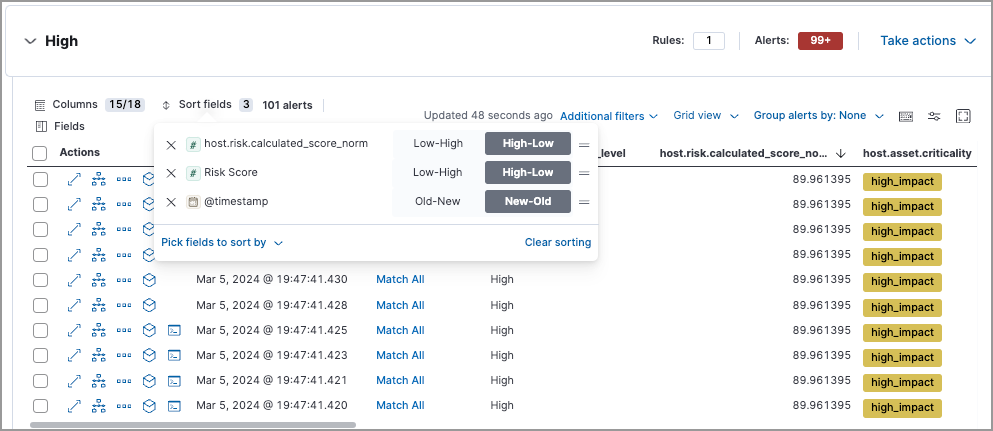
You can further sort the grouped alerts by highest entity risk score:
Expand a risk level group (for example, High) or an asset criticality group (for example, high_impact).
Select Sort fields → Pick fields to sort by.
Select fields in the following order:
host.risk.calculated_score_norm,user.risk.calculated_score_normorservice.risk.calculated_score_norm: High-LowRisk score: High-Low@timestamp: New-Old
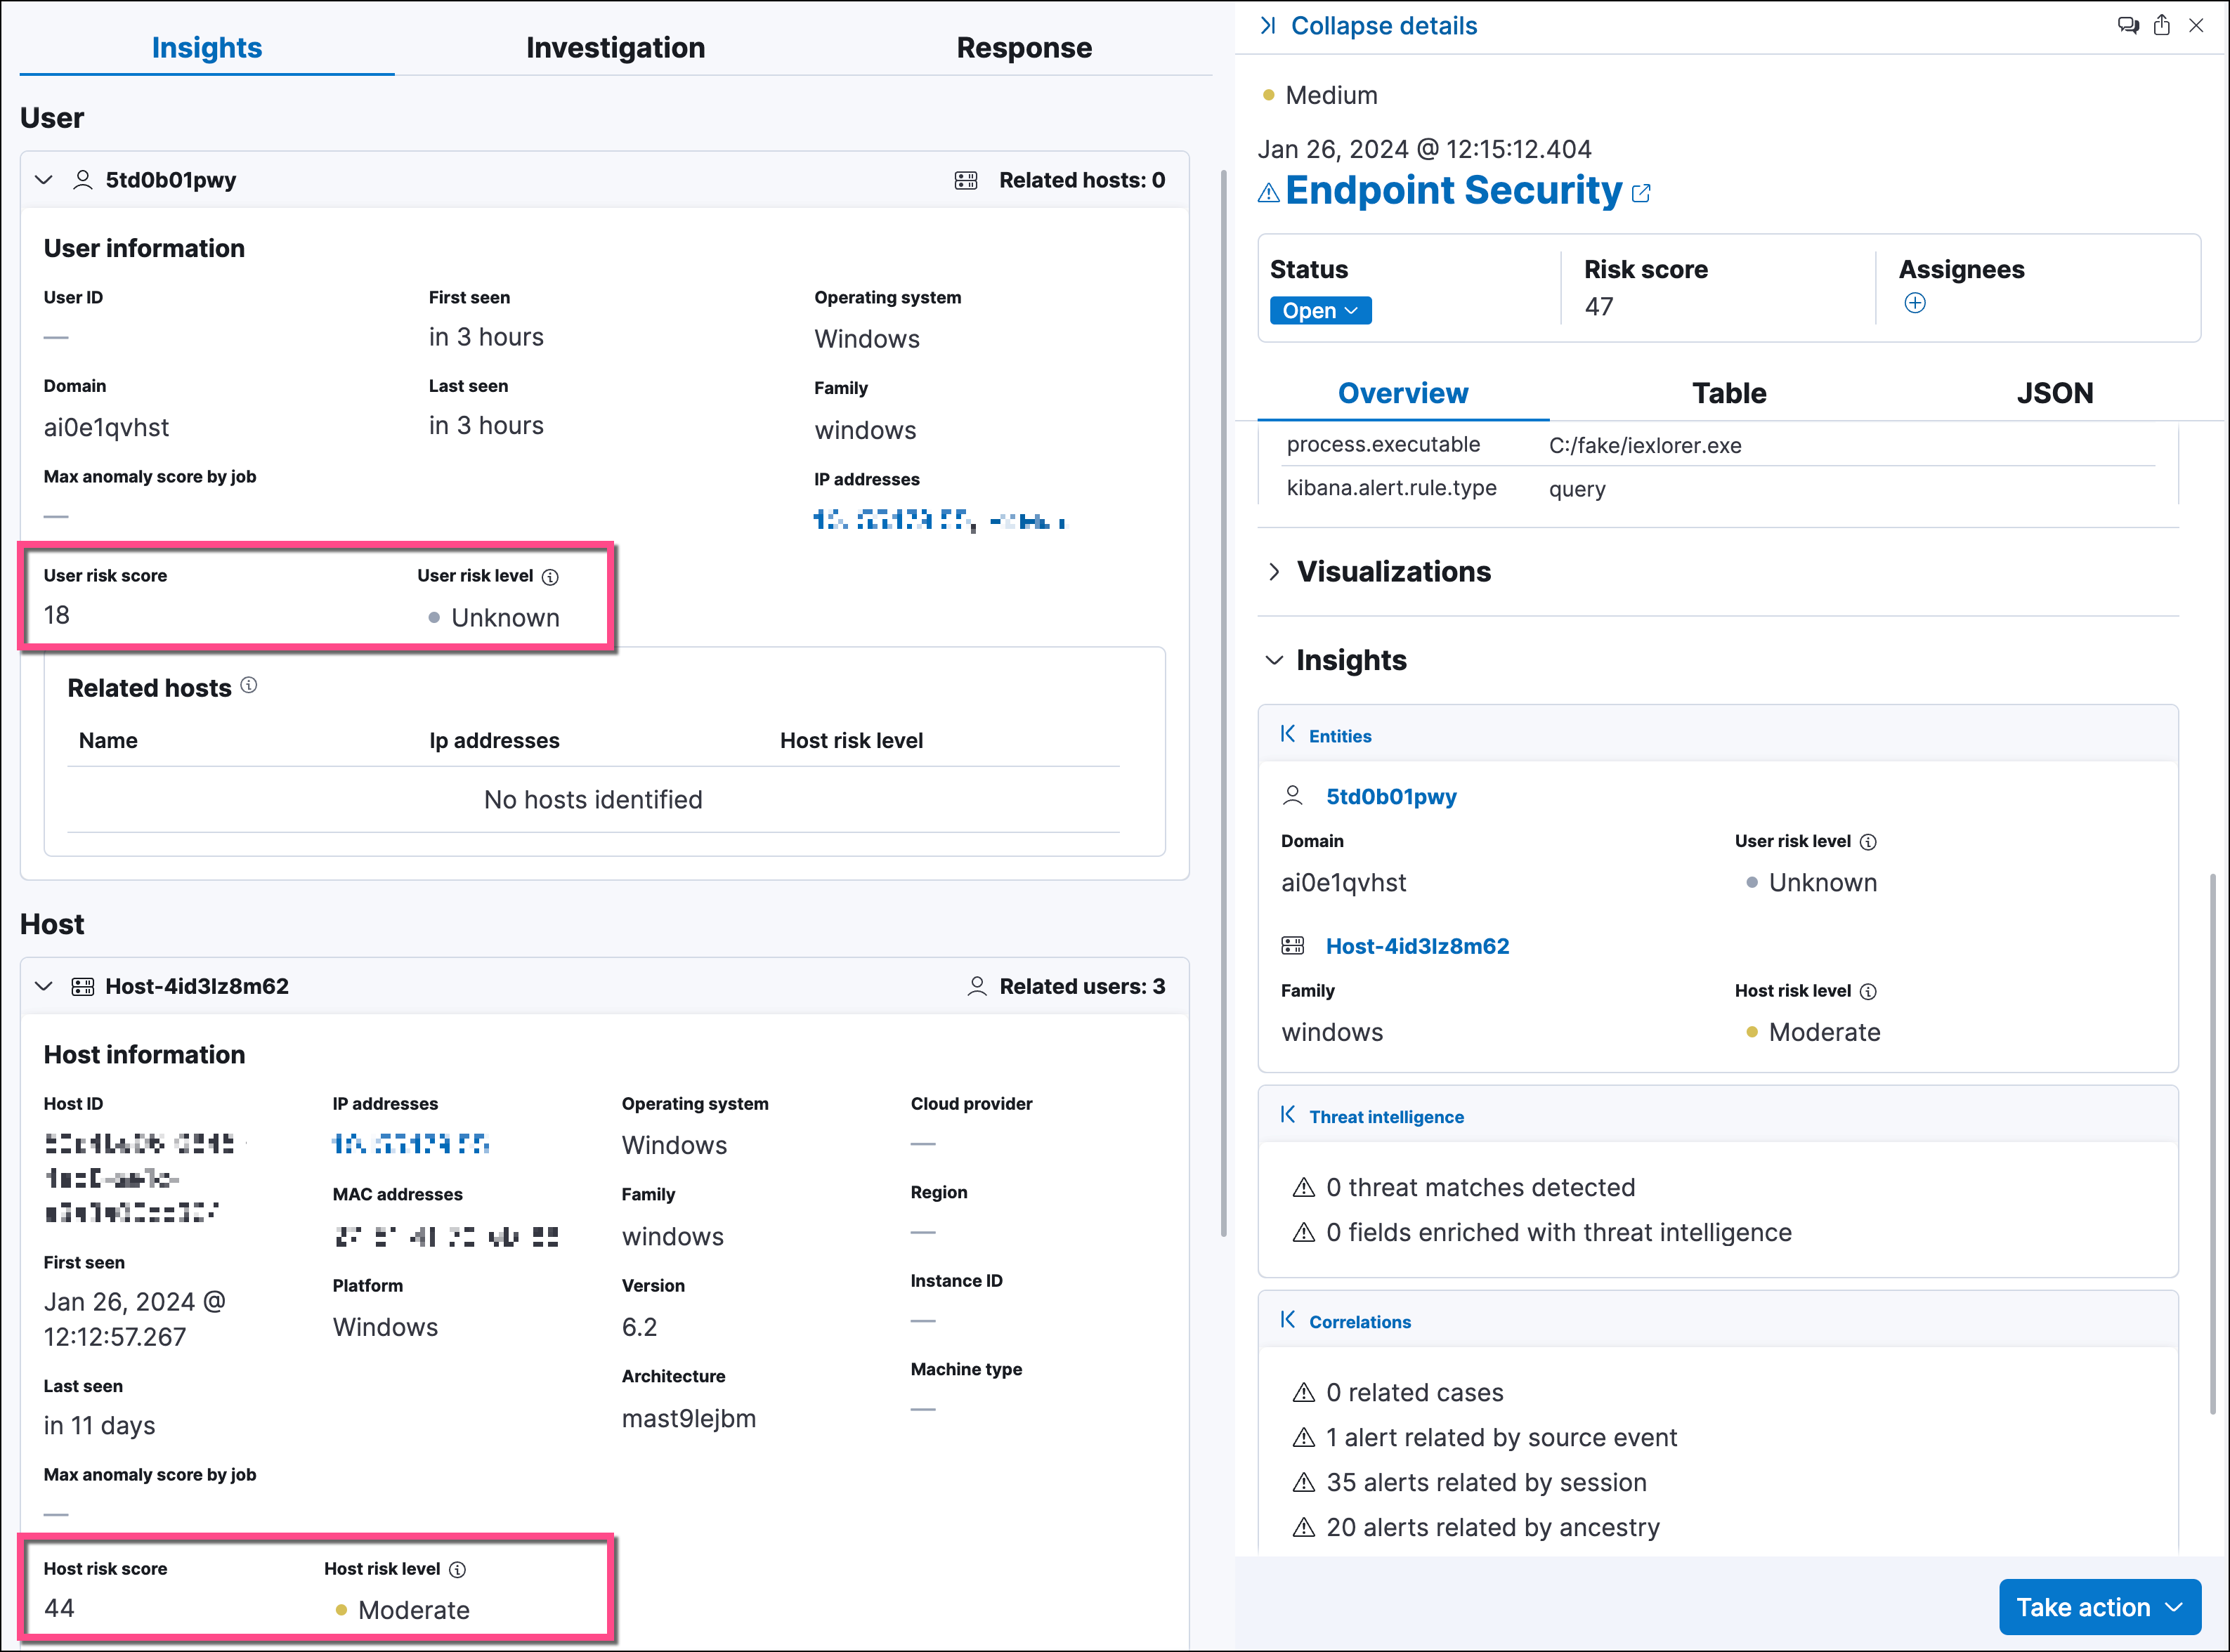
To access risk score data in the alert details flyout, select Insights → Entities on the Overview tab:
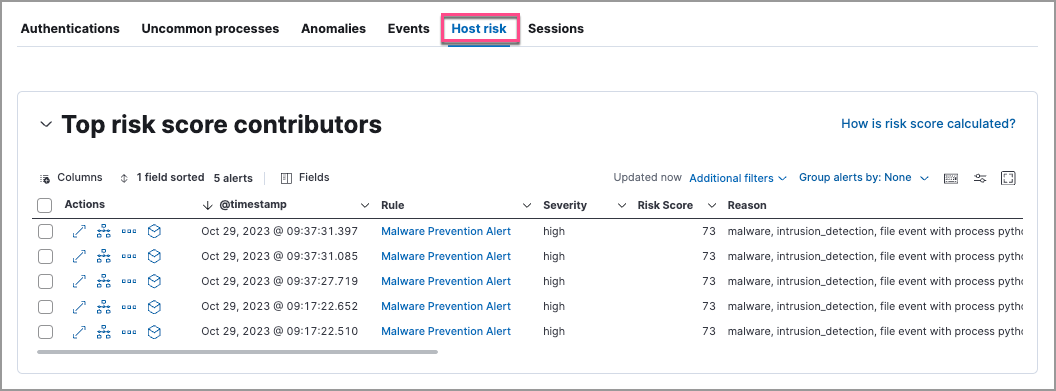
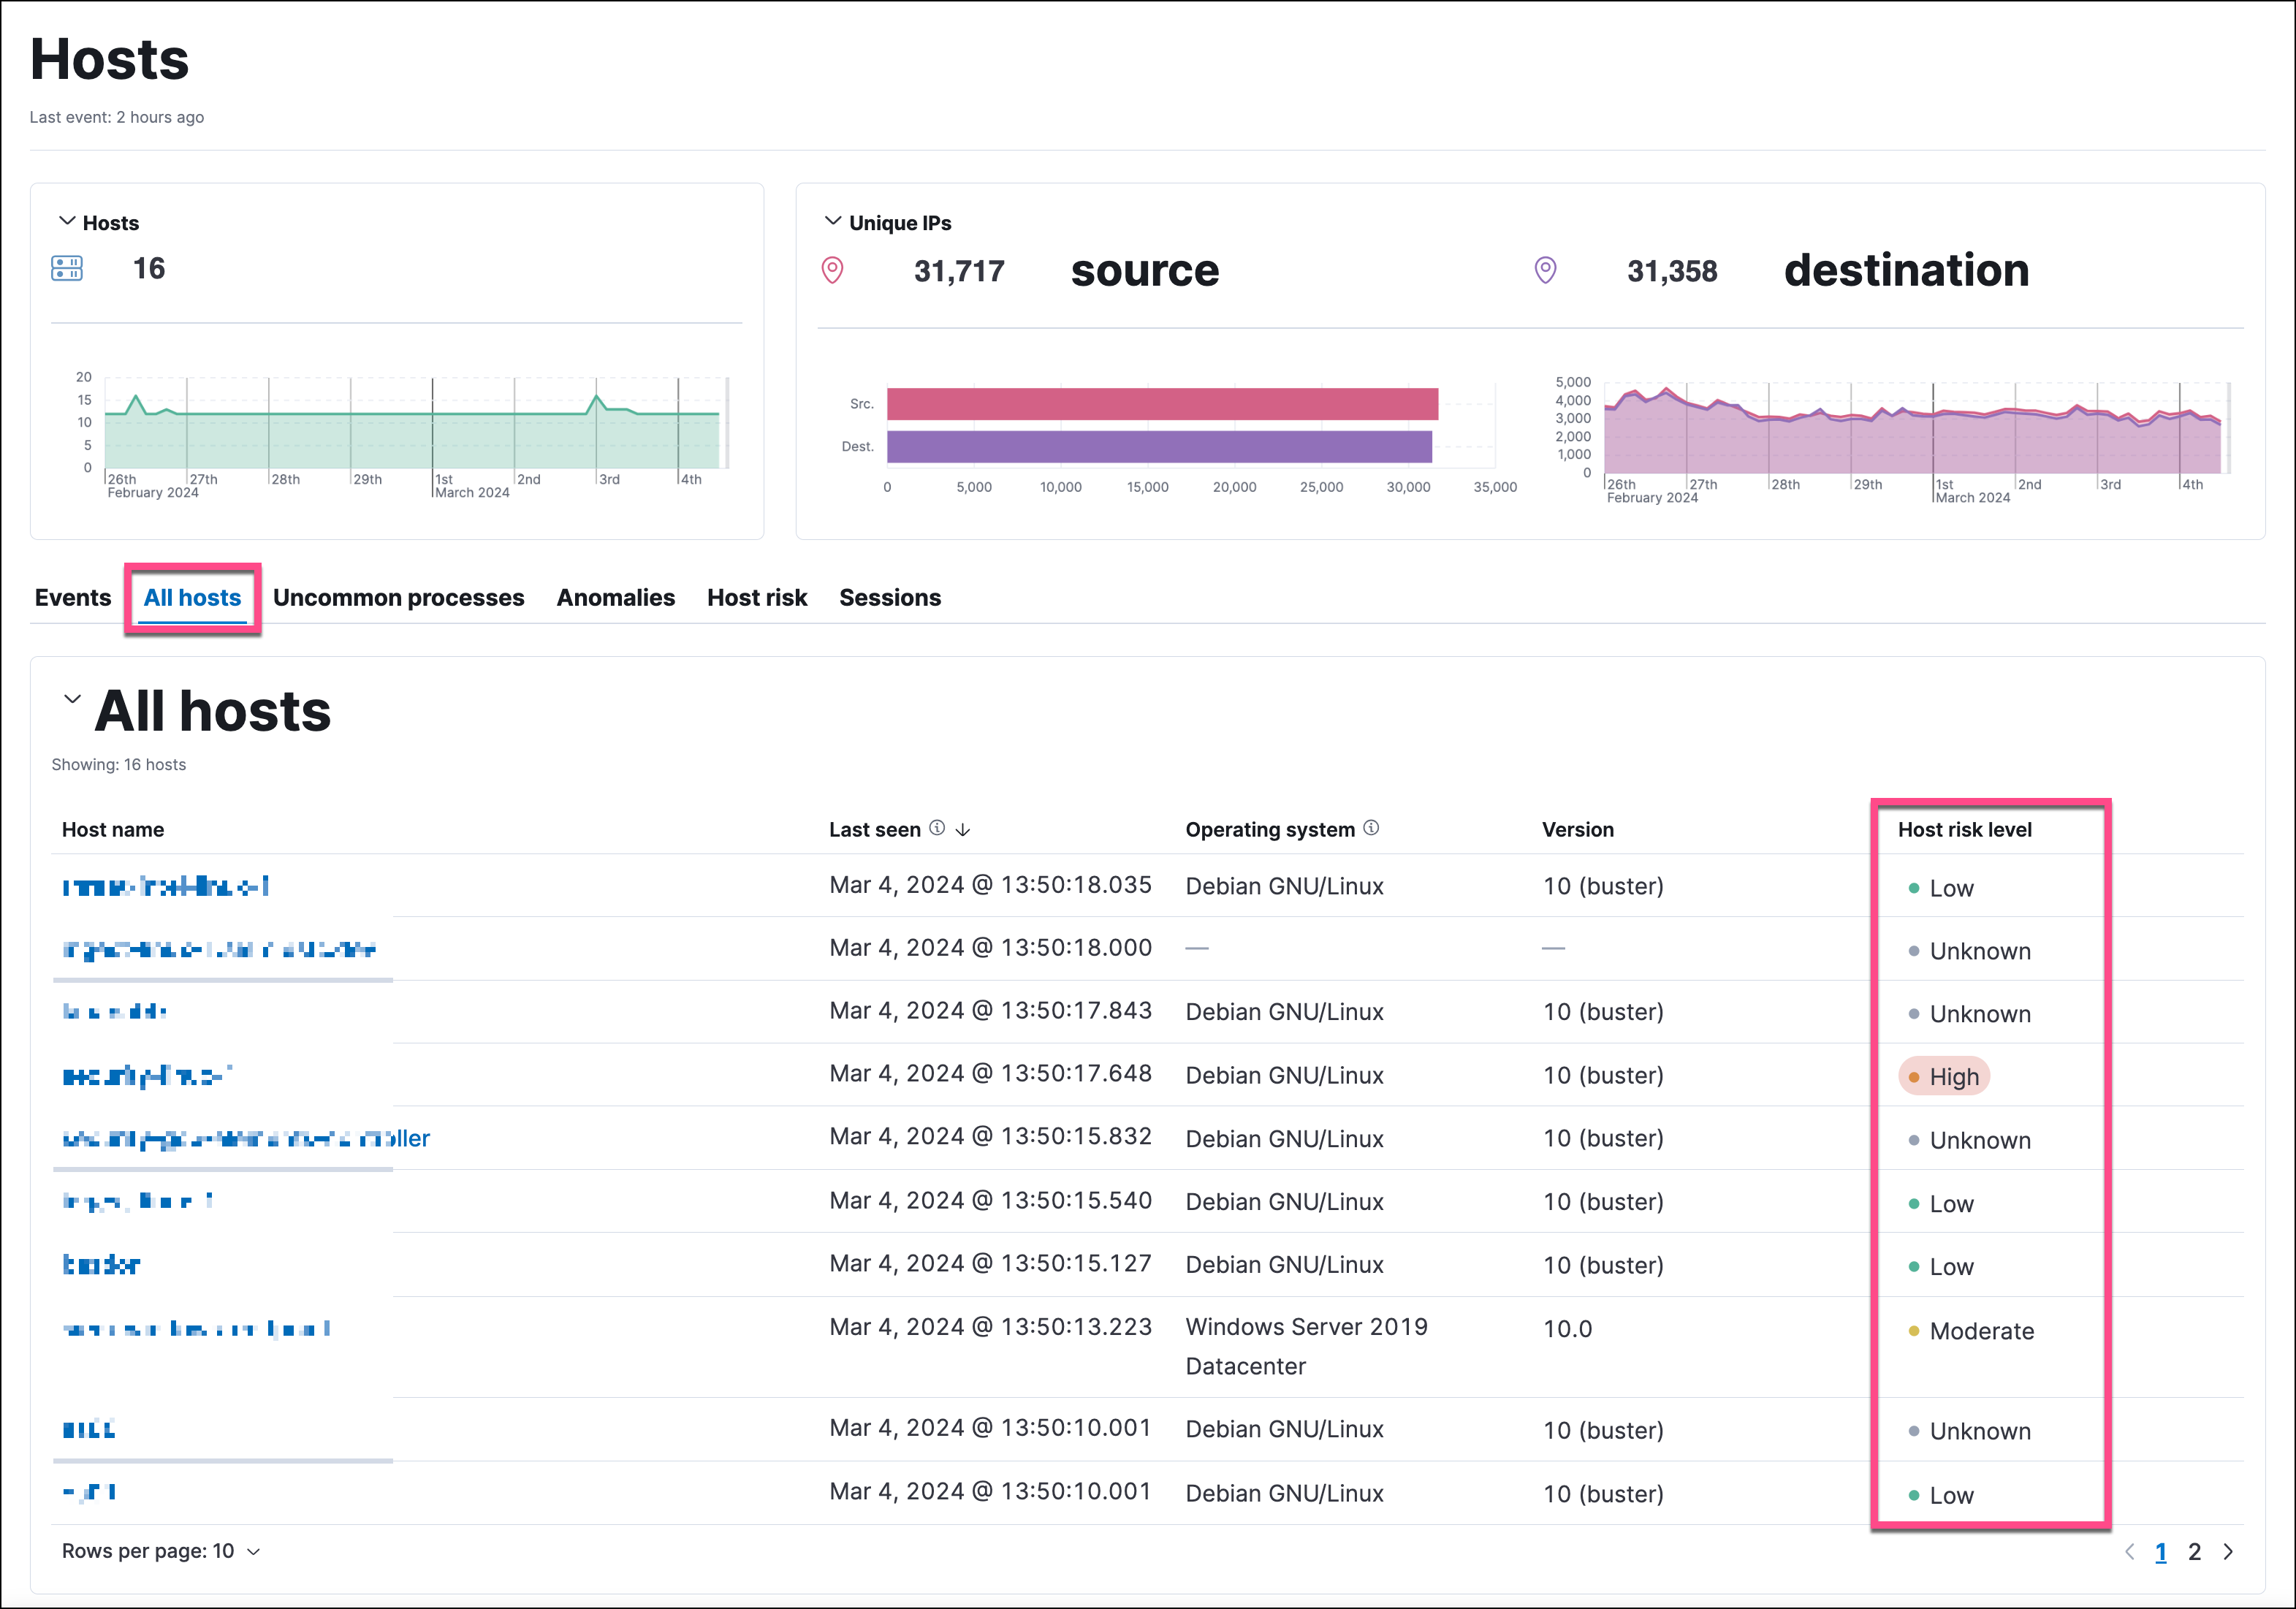
On the Hosts and Users pages, you can access the risk score data:
In the Host risk level or User risk level column on the All hosts or All users tab:
On the Host risk or User risk tab:
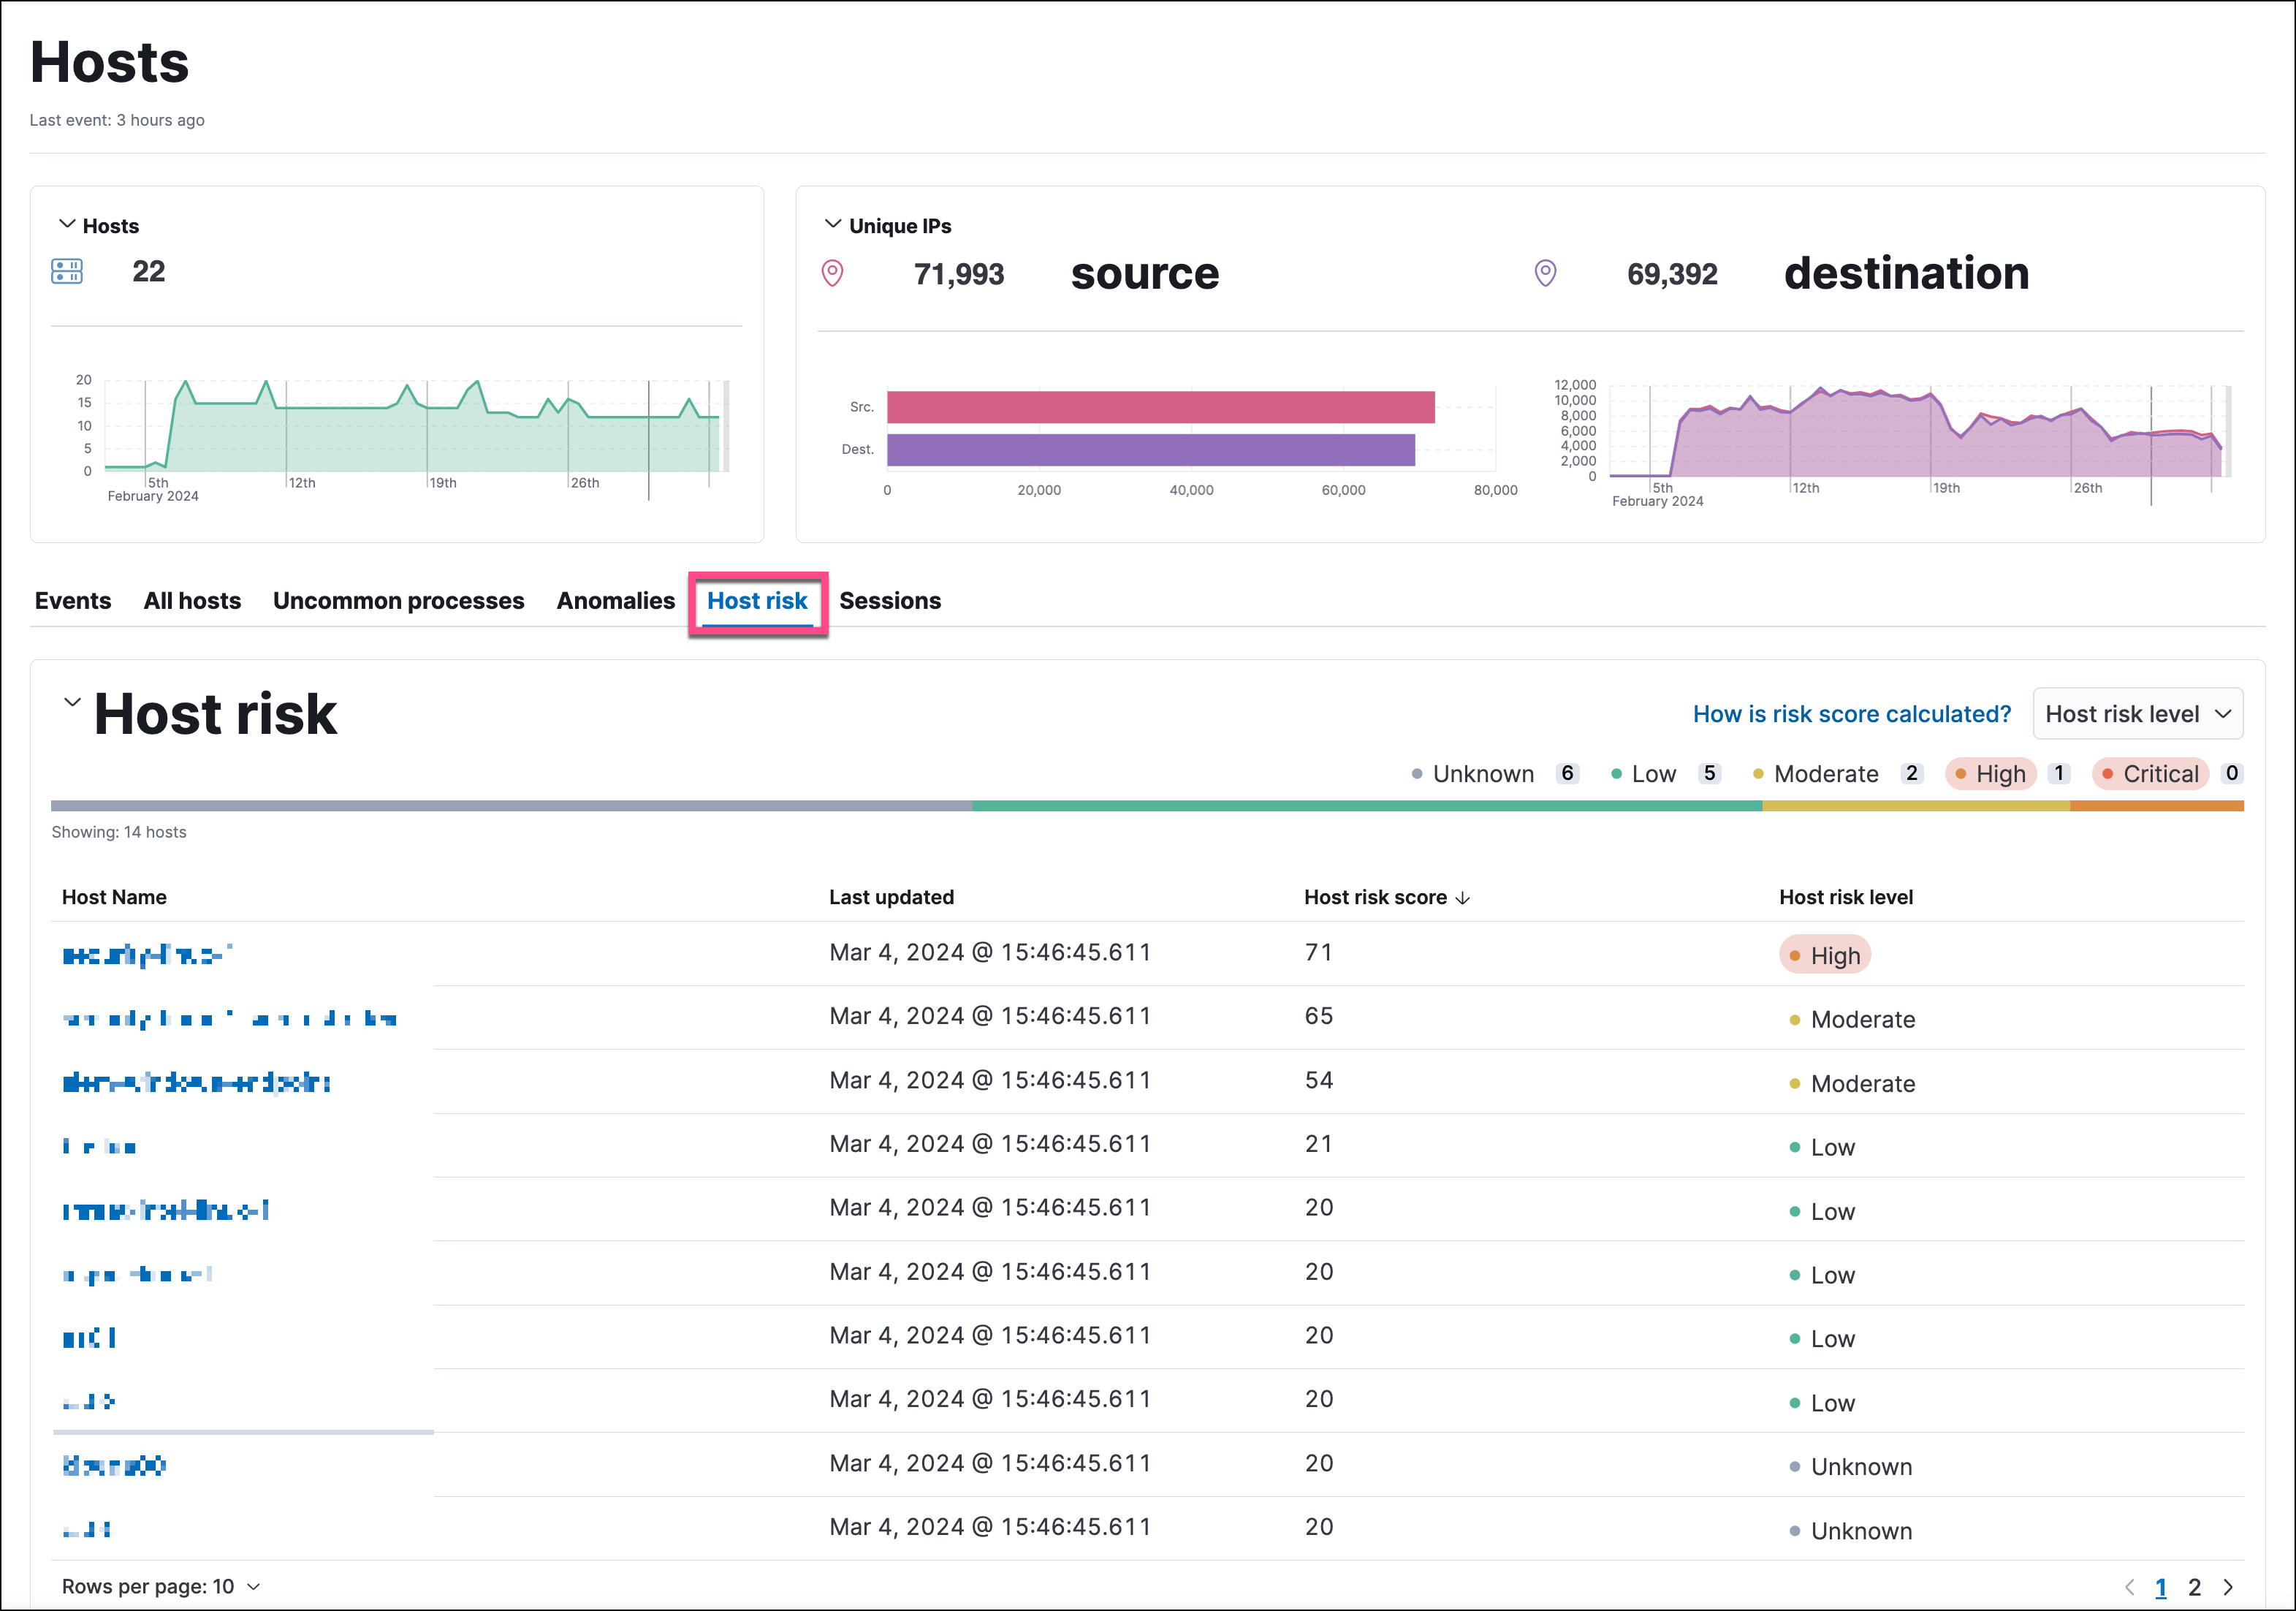
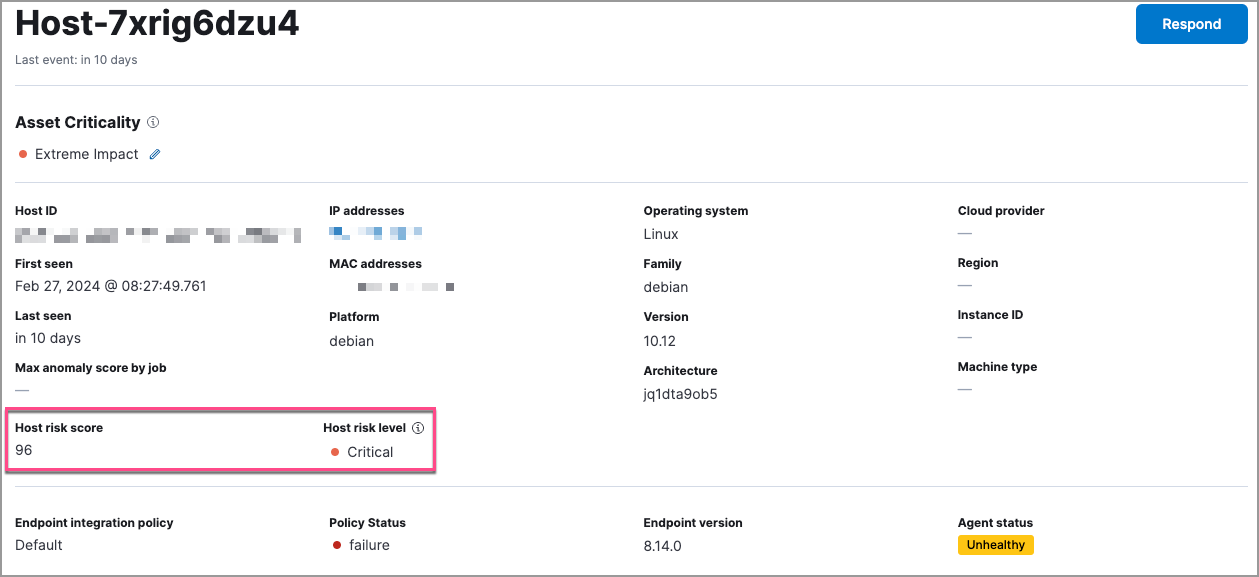
On the host details and user details pages, you can access the risk score data:
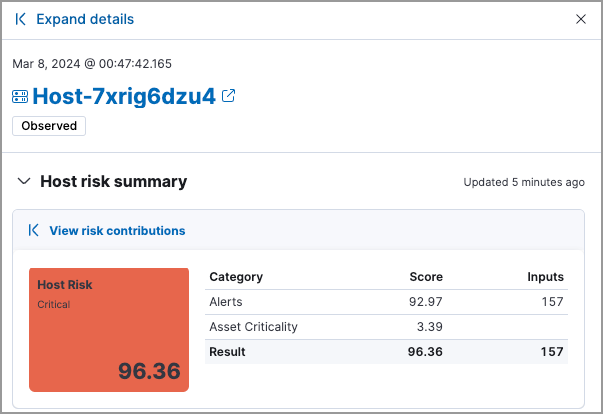
In the entity details flyouts, you can access the risk score data in the risk summary section:
Serverless Stack
The entity store allows you to analyze how entity attributes change over time, making it easier to investigate past activity, track trends, and identify unusual behavior or changes that may indicate risk. Use time-based queries in Discover to answer questions such as:
- What did user A’s attributes look like on March 15?
- How has user B's risk score changed over the last 90 days?
- Which user had the biggest jump in their risk score since yesterday?
By analyzing current and past entity data, you can understand how your environment and its entities evolve over time.
If you enabled the entity store before upgrading to 9.2, you'll need to re-start it using the On/Off toggle to access the historical analysis feature.
