Using ES|QL
Serverless Stack
The Elasticsearch Query Language, ES|QL, makes it easier to explore your data without leaving Discover.
The examples on this page use the Kibana sample web logs in Discover and Lens to explore the data and create visualizations. You can also install it by following Add sample data.
For the complete ES|QL documentation, including all supported commands, functions, and operators, refer to the ES|QL reference. For a more detailed overview of ES|QL in Kibana, refer to Use ES|QL in Kibana.
To view the ES|QL option in Discover, the enableESQL setting must be enabled from Kibana’s Advanced Settings. It is enabled by default.
To load the sample data:
Go to Discover.
Select Try ES|QL from the application menu bar.
TipIf you've entered a KQL or Lucene query in the default mode of Discover, it automatically converts to ES|QL.
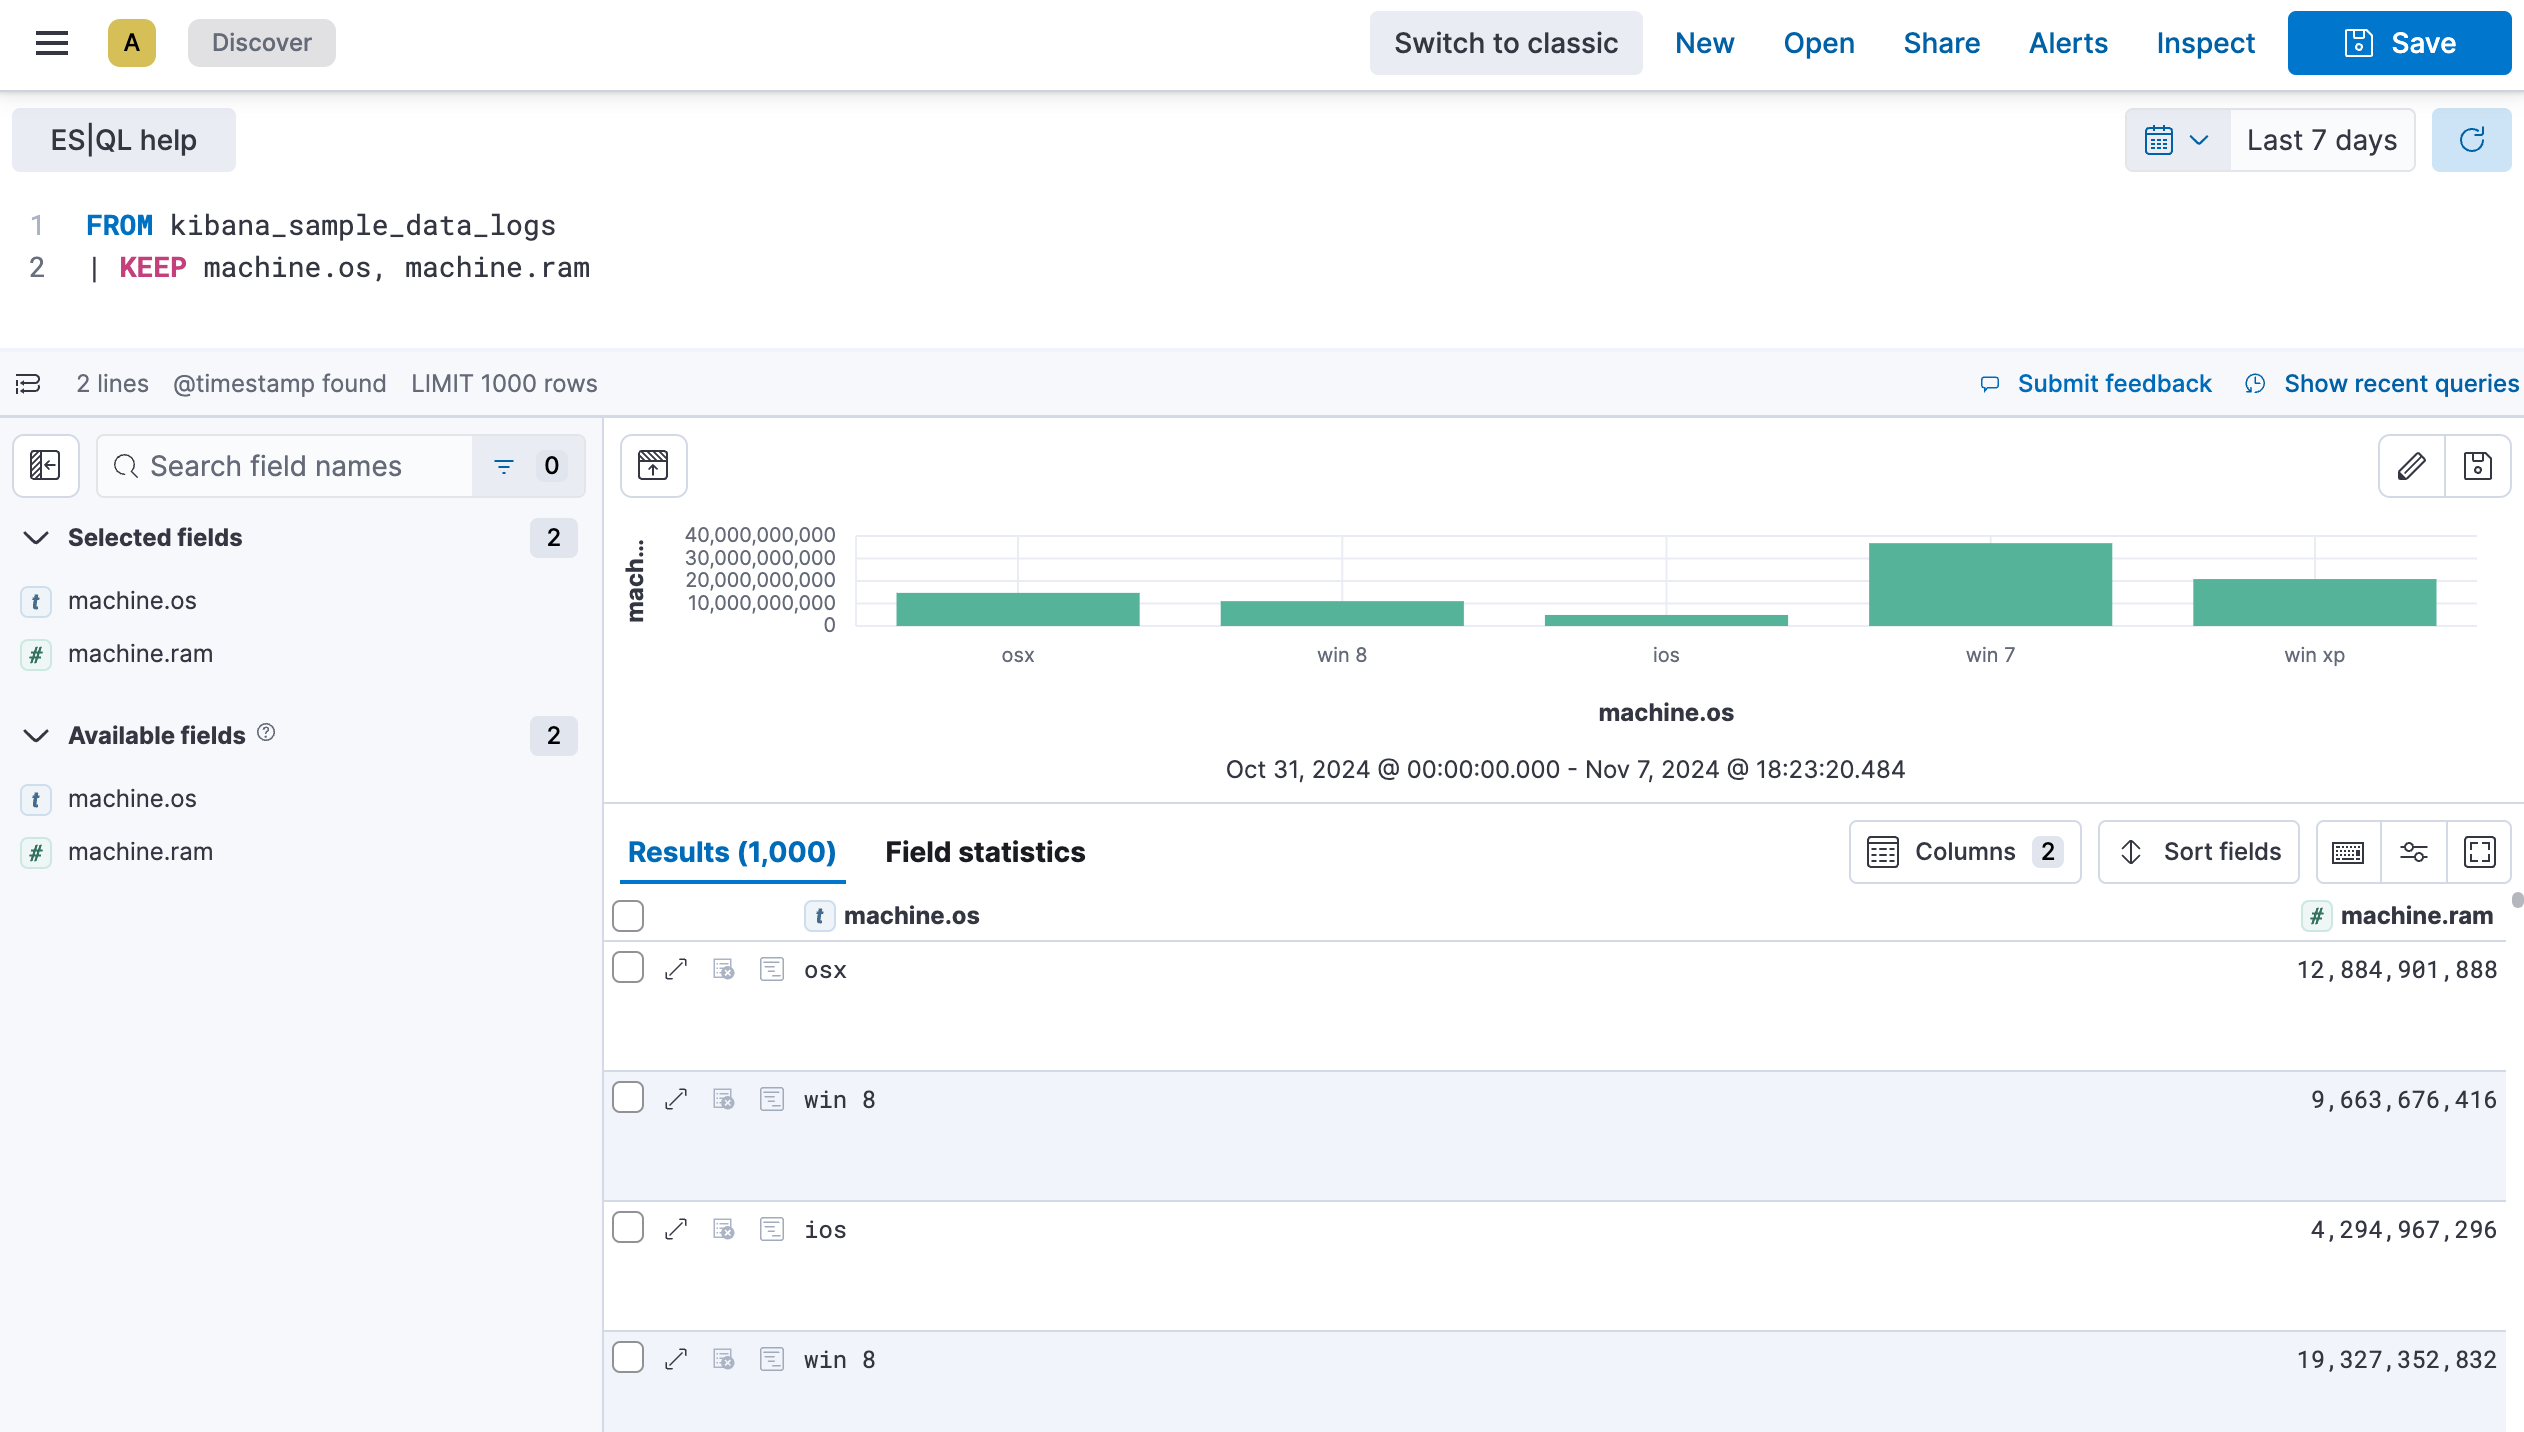
Let’s say we want to find out what operating system users have and how much RAM is on their machine.
Set the time range to Last 7 days.
Copy the following query. To make queries more readable, you can put each processing command on a new line.
FROM kibana_sample_data_logs | KEEP machine.os, machine.ram- We’re specifically looking for data from the sample web logs we just installed.
- We’re only keeping the
machine.osandmachine.ramfields in the results table.
NoteES|QL keywords are not case sensitive.
Click ▶Run.
Let’s add geo.dest to our query to find out the geographical destination of the visits and limit the results.
Copy the query below:
FROM kibana_sample_data_logs
| KEEP machine.os, machine.ram, geo.dest
| LIMIT 10
Click ▶Run again. You can notice that the table is now limited to 10 results. The visualization also updated automatically based on the query, and broke down the data for you.
NoteWhen you don’t specify any specific fields to retain using
KEEP, the visualization isn’t broken down automatically. Instead, an additional option appears above the visualization and lets you select a field manually.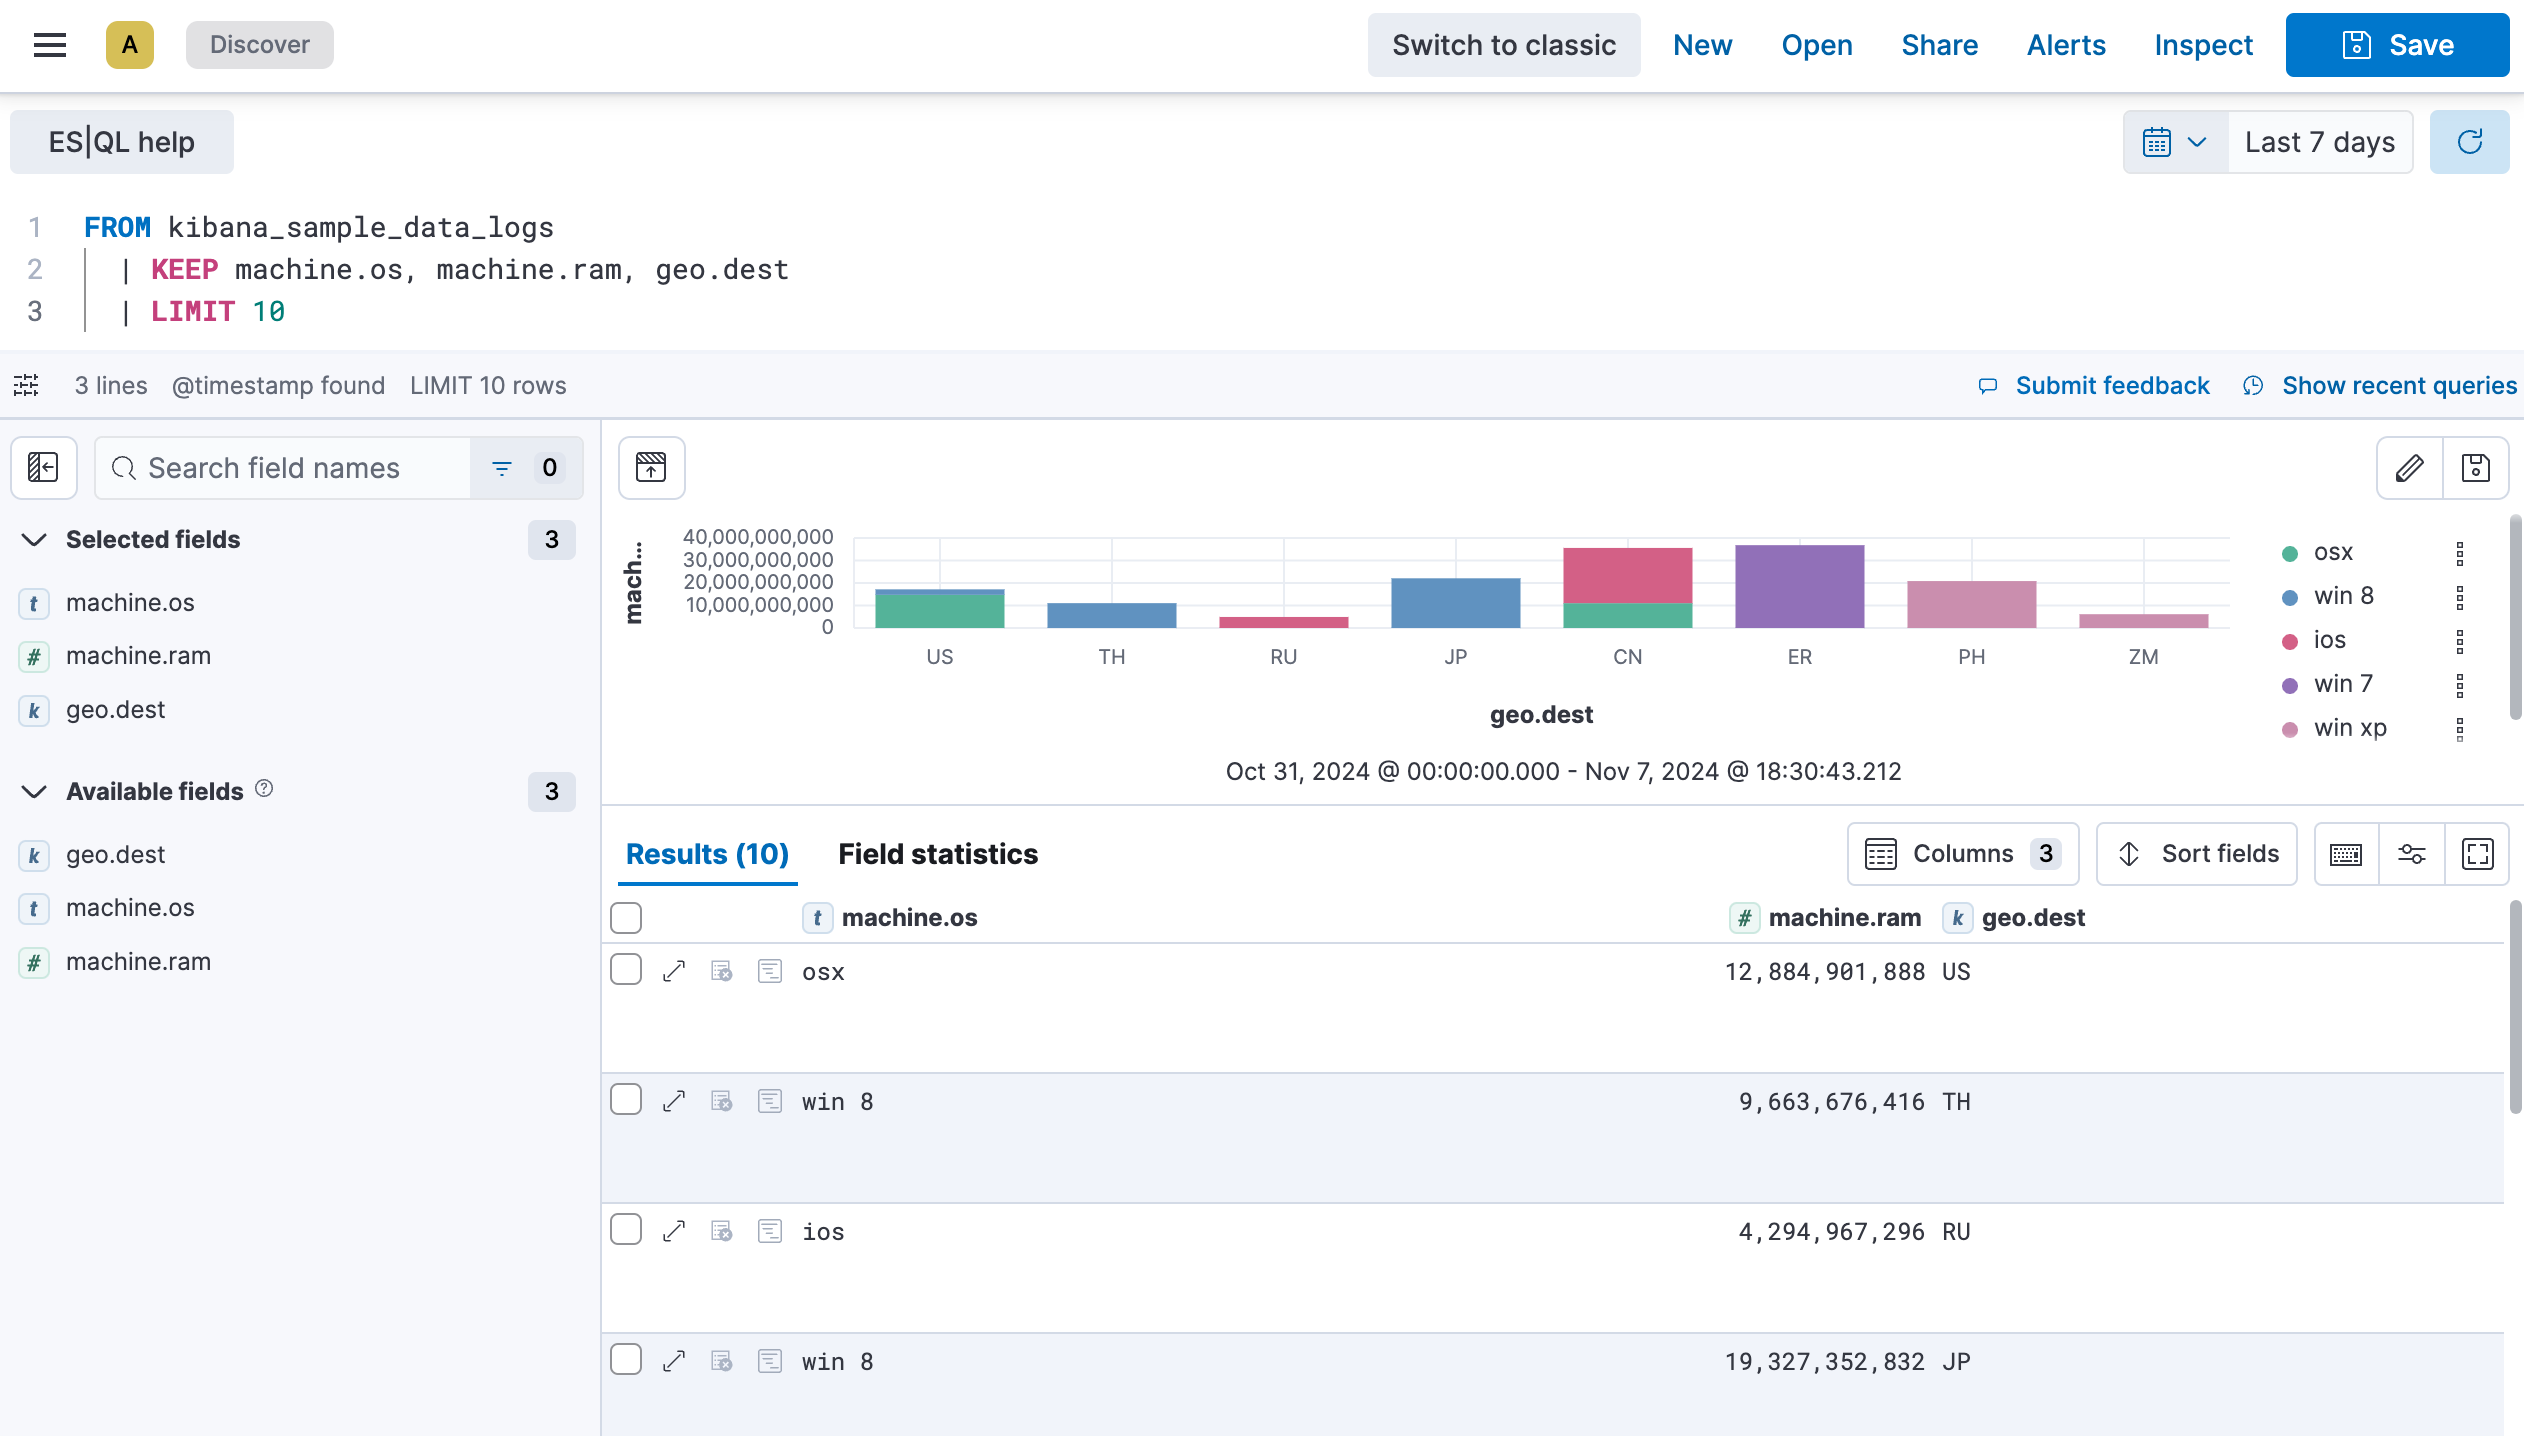
We will now take it a step further to sort the data by machine ram and filter out the GB destination.
Copy the query below:
FROM kibana_sample_data_logs
| KEEP machine.os, machine.ram, geo.dest
| SORT machine.ram desc
| WHERE geo.dest != "GB"
| LIMIT 10
Click ▶Run again. The table and visualization no longer show results for which the
geo.destfield value is "GB", and the results are now sorted in descending order in the table based on themachine.ramfield.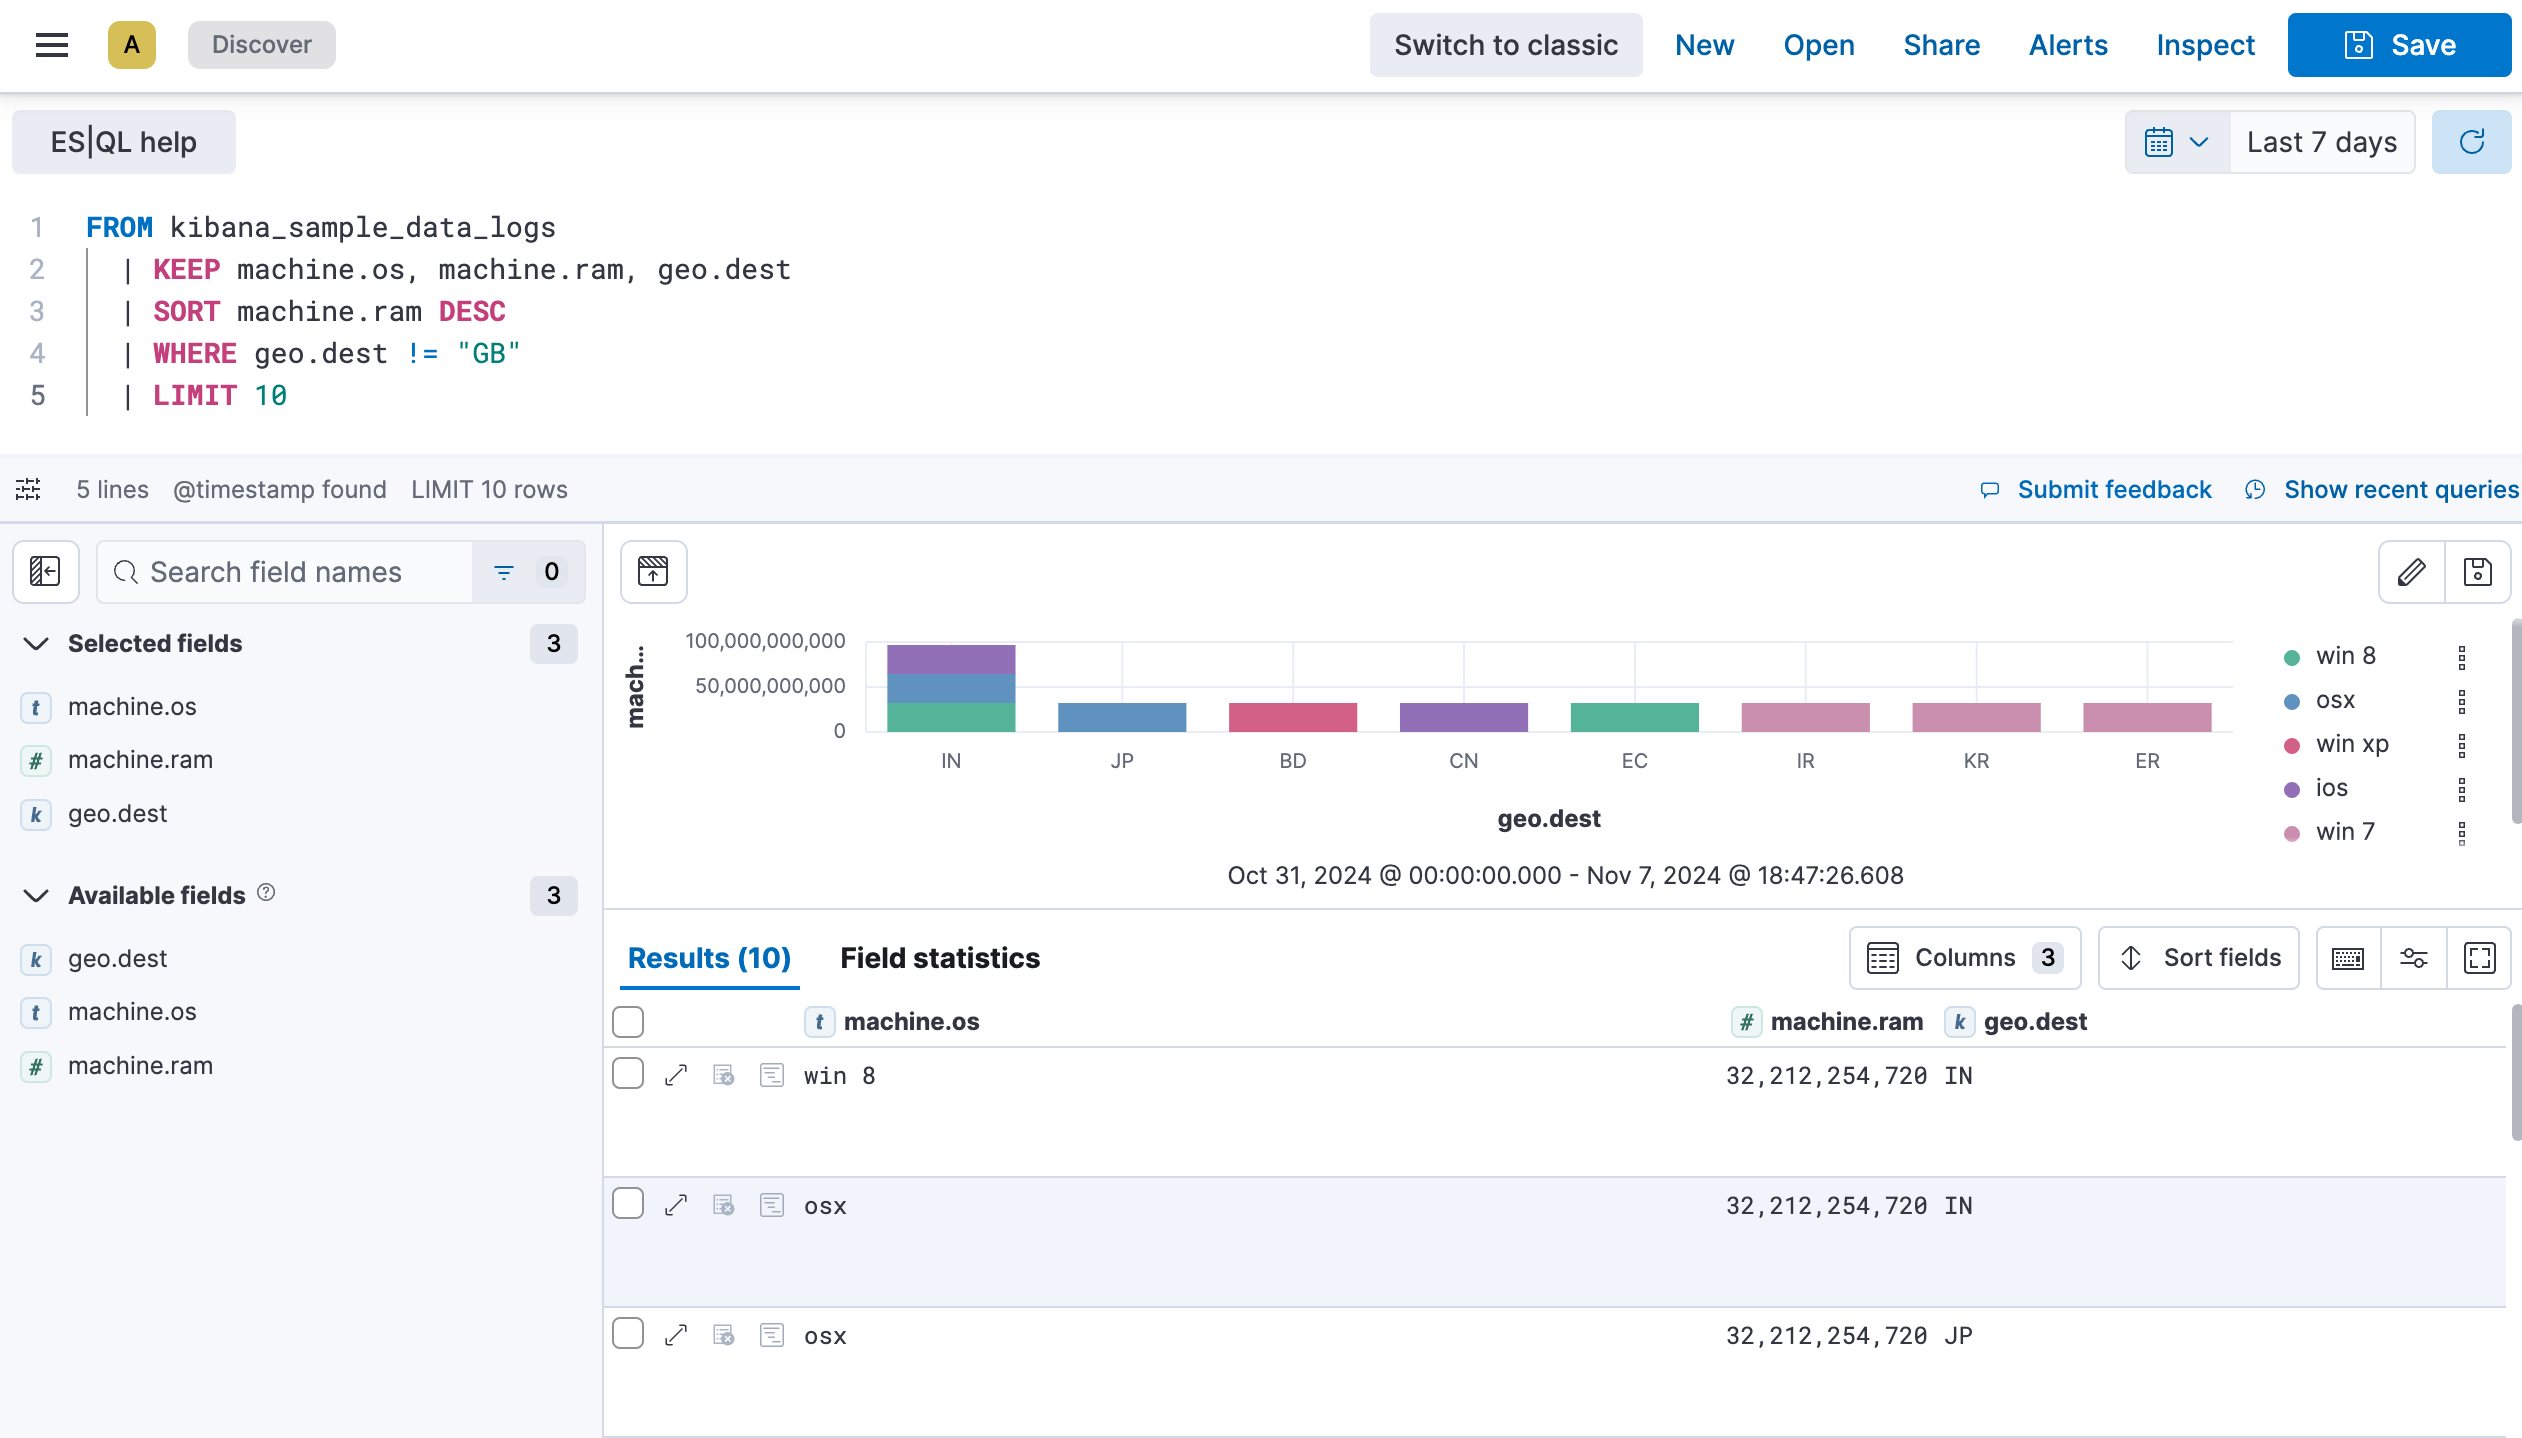
Click Save to save the query and visualization to a dashboard.
You can make changes to the visualization by clicking the pencil icon. This opens additional settings that let you adjust the chart type, axes, breakdown, colors, and information displayed to your liking. If you’re not sure which route to go, check one of the suggestions available in the visualization editor.
If you’d like to keep the visualization and add it to a dashboard, you can save it using the floppy disk icon.
By default, ES|QL identifies time series data when an index contains a @timestamp field. This enables the time range selector and visualization options for your query.
If your index doesn’t have an explicit @timestamp field, but has a different time field, you can still enable the time range selector and visualization options by calling the ?_tstart and ?_tend parameters in your query.
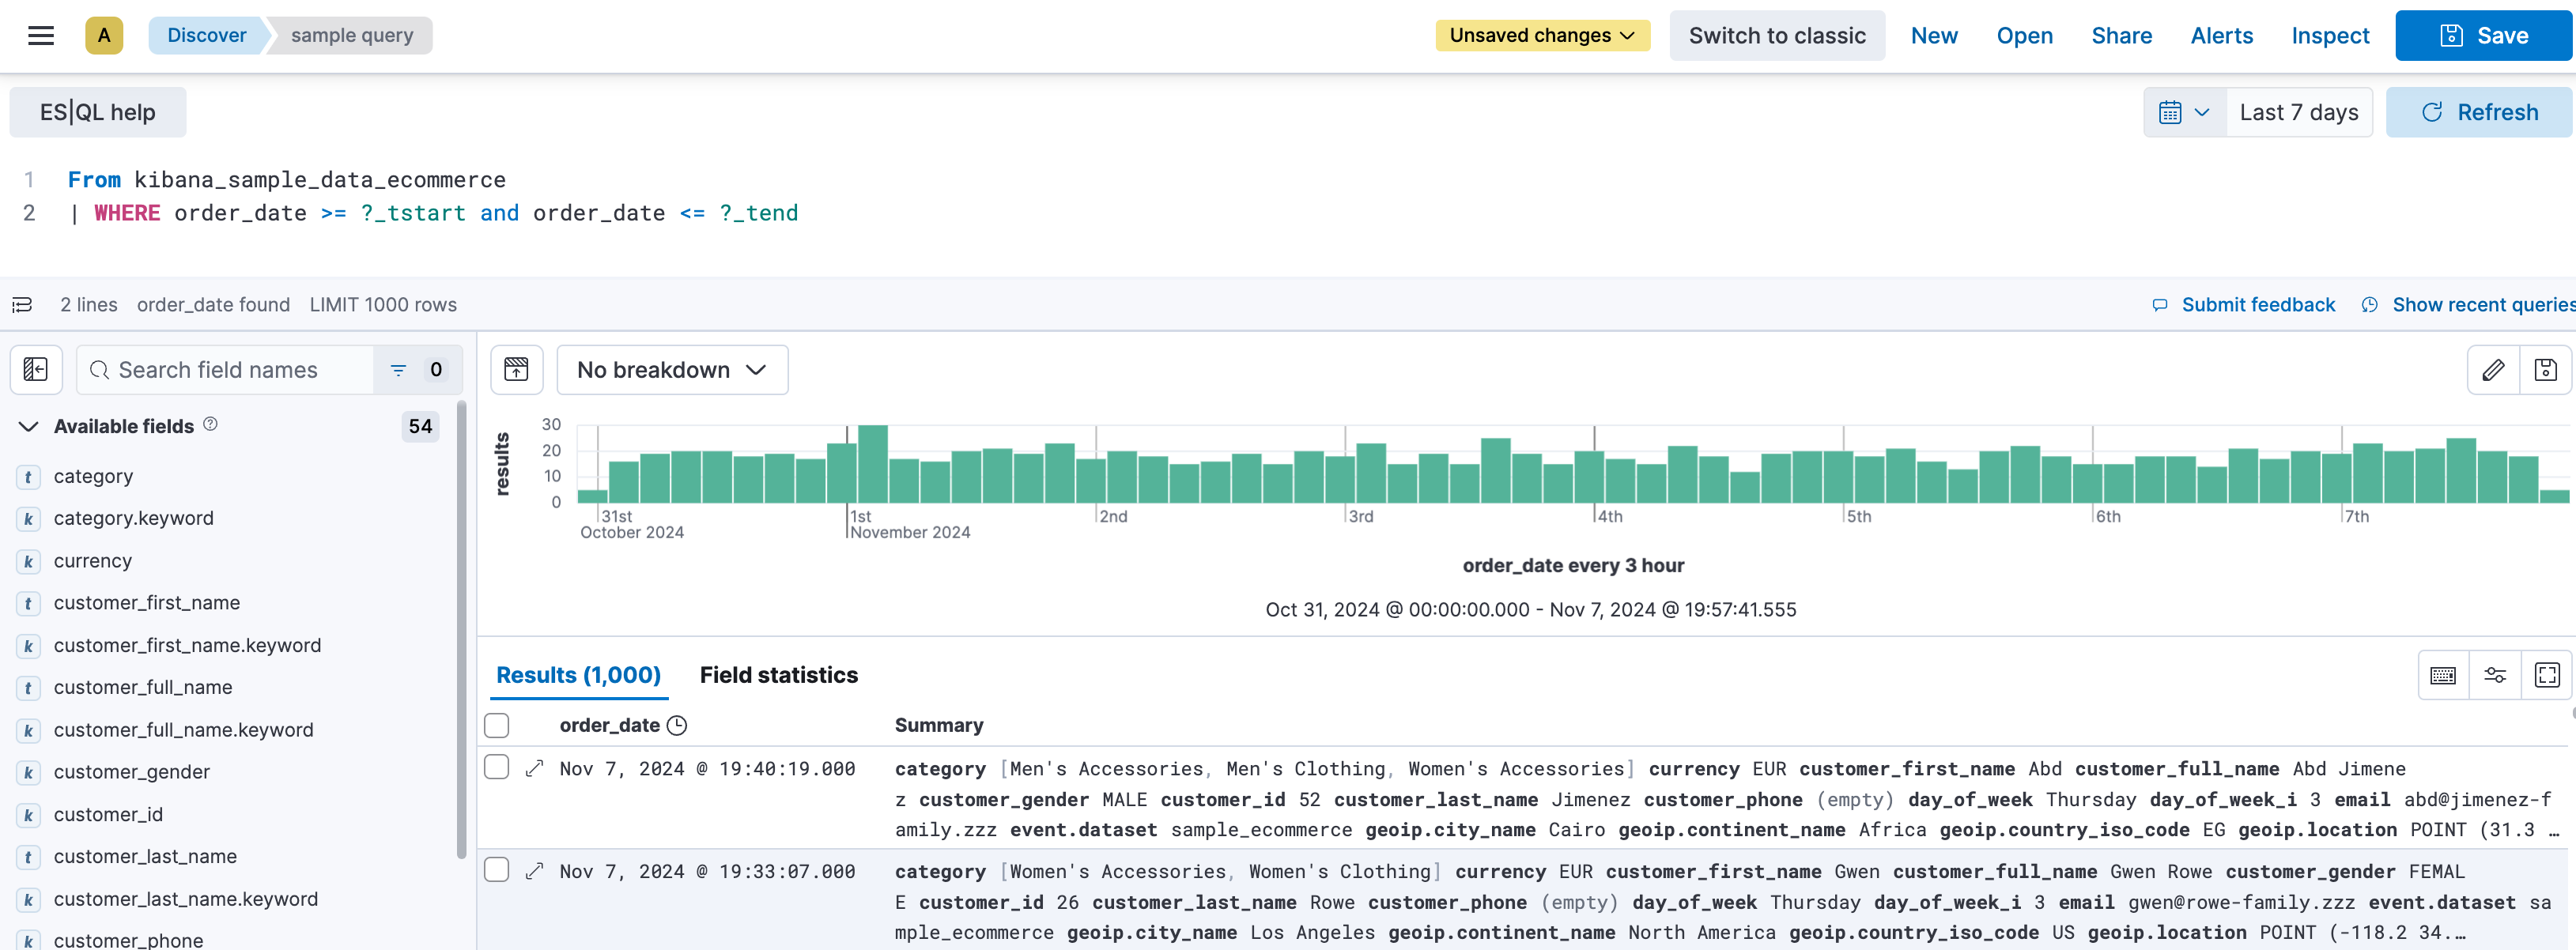
For example, the eCommerce sample data set doesn’t have a @timestamp field, but has an order_date field.
By default, when querying this data set, time series capabilities aren’t active. No visualization is generated and the time picker is disabled.
FROM kibana_sample_data_ecommerce
| KEEP customer_first_name, email, products._id.keyword
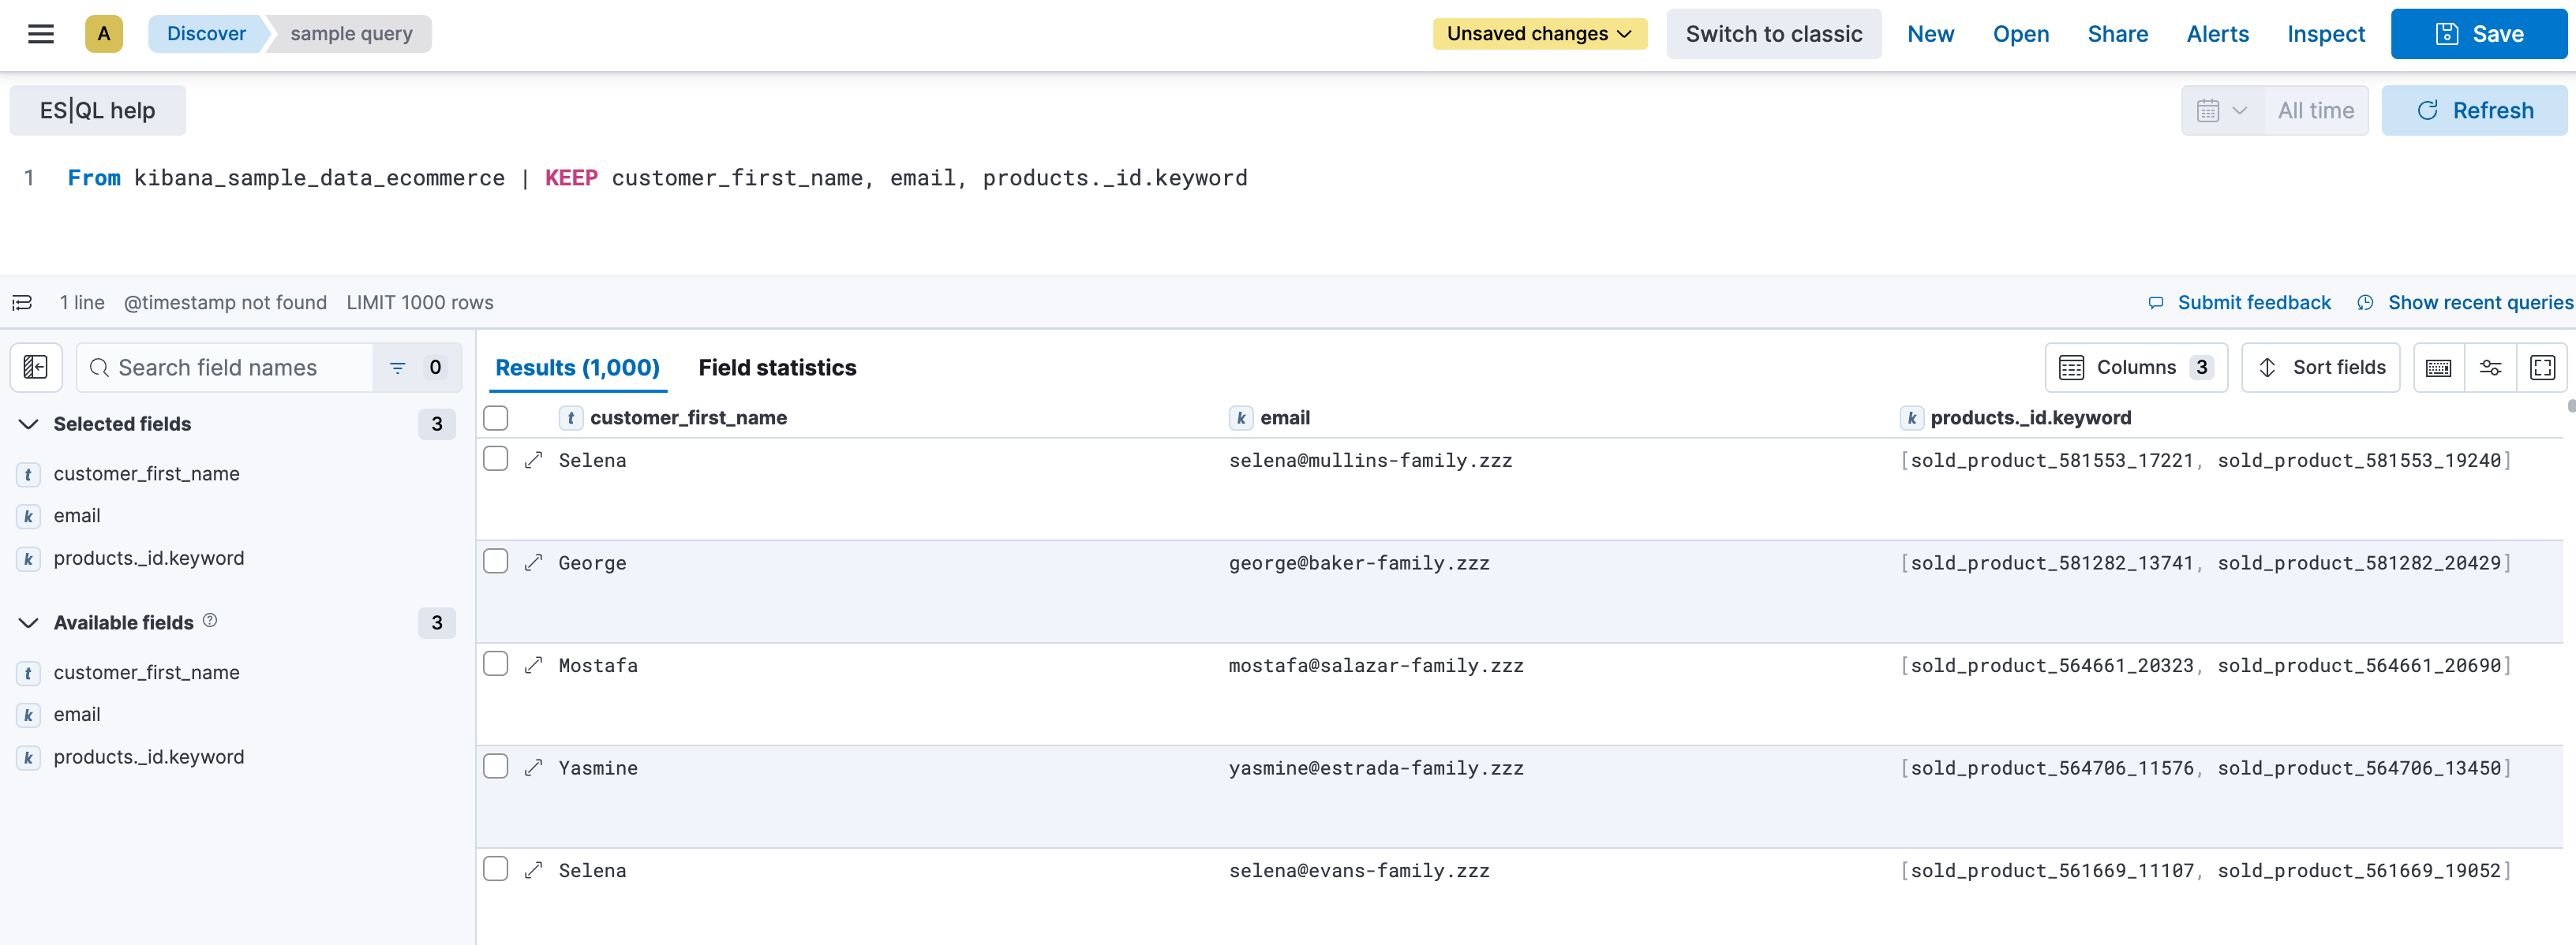
While still querying the same data set, by adding the ?_tstart and ?_tend parameters based on the order_date field, Discover enables times series capabilities.
FROM kibana_sample_data_ecommerce
| WHERE order_date >= ?_tstart and order_date <= ?_tend
Serverless Stack
In Discover, LOOKUP JOIN commands include interactive options that let you create or edit lookup indices directly from the editor.
You can create a lookup index directly from the ES|QL editor. To populate this index, you can type in data manually or upload a CSV file up to 500 MB.
To create lookup indices, you need the create_index Elasticsearch privilege on the corresponding pattern.
In your ES|QL query, add a
LOOKUP JOINcommand. For example:FROM kibana_sample_data_logs | LOOKUP JOINAdd a space after the command. The editor suggests existing lookup indices and offers to create one. You can also type an index name in your query. If it doesn't exist, the editor suggests to create it.
Select the Create lookup index suggestion that appears in the autocomplete menu.
Define a name for the lookup index, then validate it.
- It must not contain spaces nor any of the following characters:
\,/,*,?,<,>,|,:, and#. - It must not start with
-,_, or+.
- It must not contain spaces nor any of the following characters:
Provide the data of the lookup index. You can choose between:
- Uploading a CSV file up to 500 MB. When uploading a file, you can preview the data and inspect the file's content before it is imported. If issues are detected, a File issues tab with more details also appears before you validate the import.
- Adding data manually. To do that, you can add rows and columns, and edit cells directly.
- Using a combination of both methods. You can upload a file after adding data manually, and edit or expand data imported from a file.
TipYou can explore your index using the search field, or in a new Discover session by selecting Open in Discover. If you choose to open it in Discover, a new browser tab opens with a prefilled ES|QL query on the index.
Save any unsaved changes, then Close the index editor to return to your query.
Your new index is automatically added to your query. You can then specify the field to join using ON <field_to_join>.
You can view and modify existing lookup indices referenced in an ES|QL query directly from the editor, depending on your privileges:
- To edit lookup indices, you need the
writeElasticsearch privilege. - To view lookup indices in read-only mode, you need the
view_index_metadataElasticsearch privilege.
To view or edit an index:
In the ES|QL query, hover over the lookup index name.
Select the Edit lookup index or View lookup index option that appears. A flyout showing the index appears.
Depending on your permissions and needs, explore or edit the index.
NoteEditing a lookup index affects all ES|QL queries that reference it. Make sure that your changes are compatible with existing queries that use this index.
If you made changes, select Save before closing the flyout.