ES|QL visualizations
Serverless Stack
You can add ES|QL visualizations to a dashboard directly from queries in Discover, or you can start from a dashboard.
In Discover, typing ES|QL queries automatically shows a visualization. The visualization type depends on the content of the query: histogram, bar charts, etc. You can manually make changes to that visualization and edit its type and display options using the pencil button .
You can then Save and add it to an existing or a new dashboard using the save button of the visualization .
From your dashboard, select Add panel.
TipIf you haven't created a data view and you don't have a dashboard yet, the Dashboards page offers you the possibility to Try ES|QL right away. By selecting this option, a dashboard is created with an ES|QL visualization that you can interact with and configure using ES|QL.
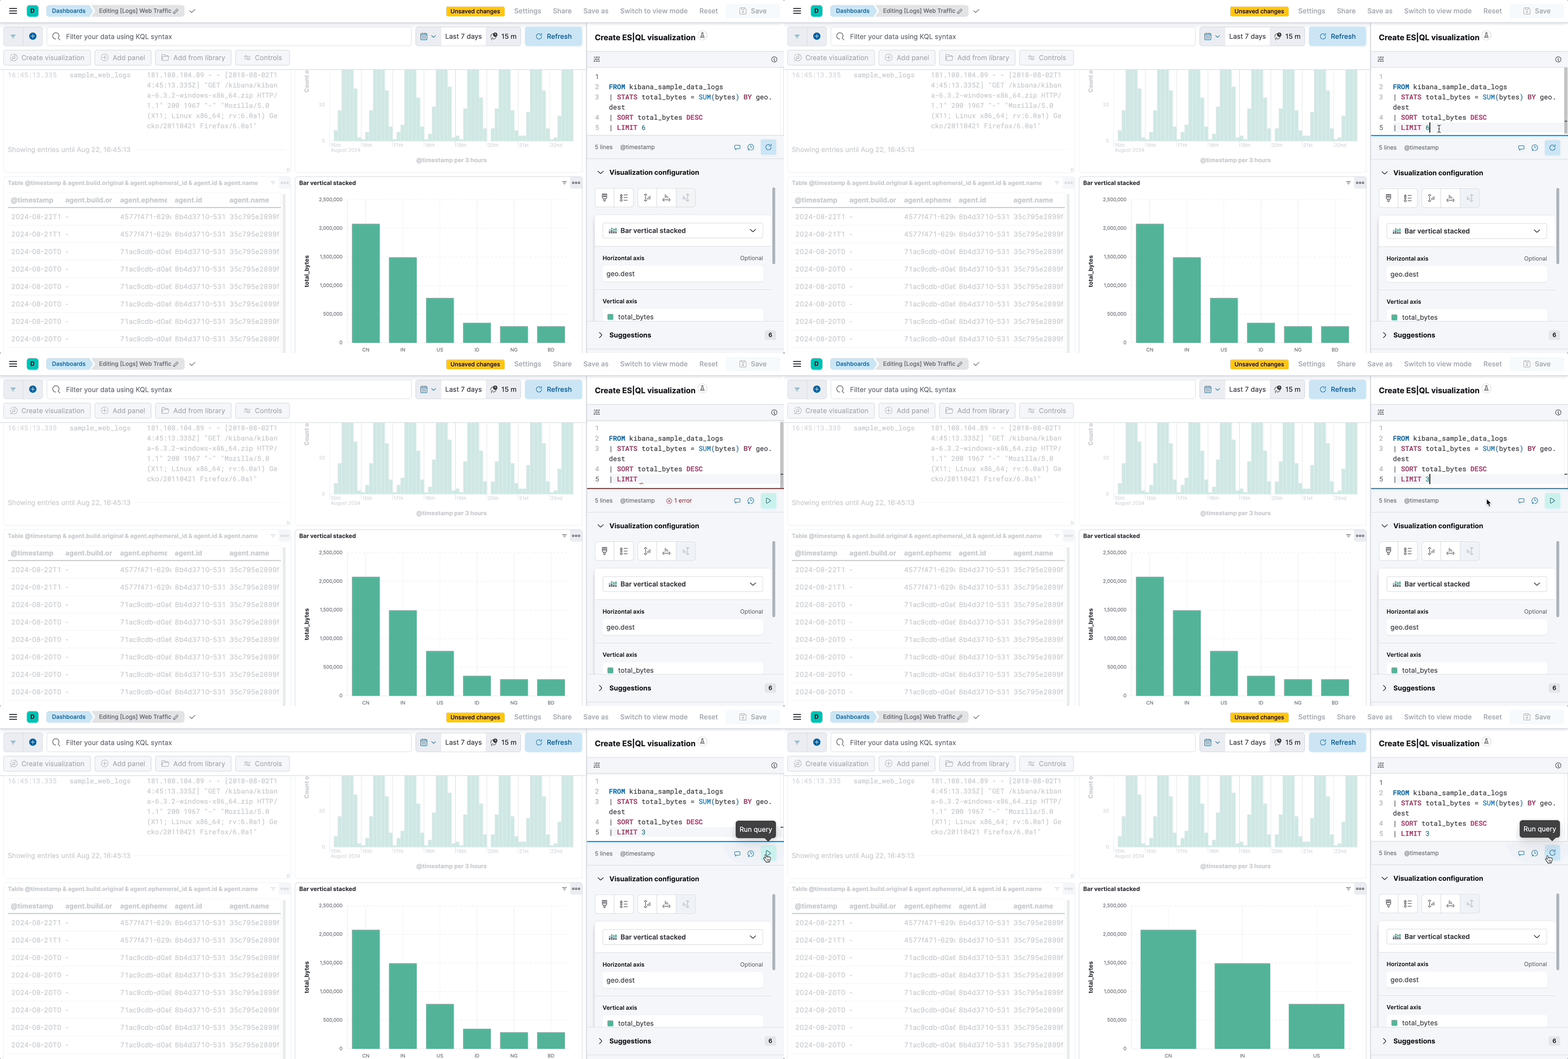
Choose ES|QL under Visualizations. An ES|QL editor appears and lets you configure your query and its associated visualization. The Suggestions panel can help you find alternative ways to configure the visualization.
TipCheck the ES|QL reference to get familiar with the syntax and optimize your query.
When editing your query or its configuration, run the query to update the preview of the visualization.
 Note
NoteStack Serverless
When you edit the query and run it again, the visualization configuration persists as long as it is compatible with the query changes. Refer to ES|QL visualizations > Chart configuration persistence over ES|QL query update for more details.
You can bind controls to your ES|QL visualizations in dashboards by creating ES|QL controls.
Select Apply and close to save the visualization to the dashboard.
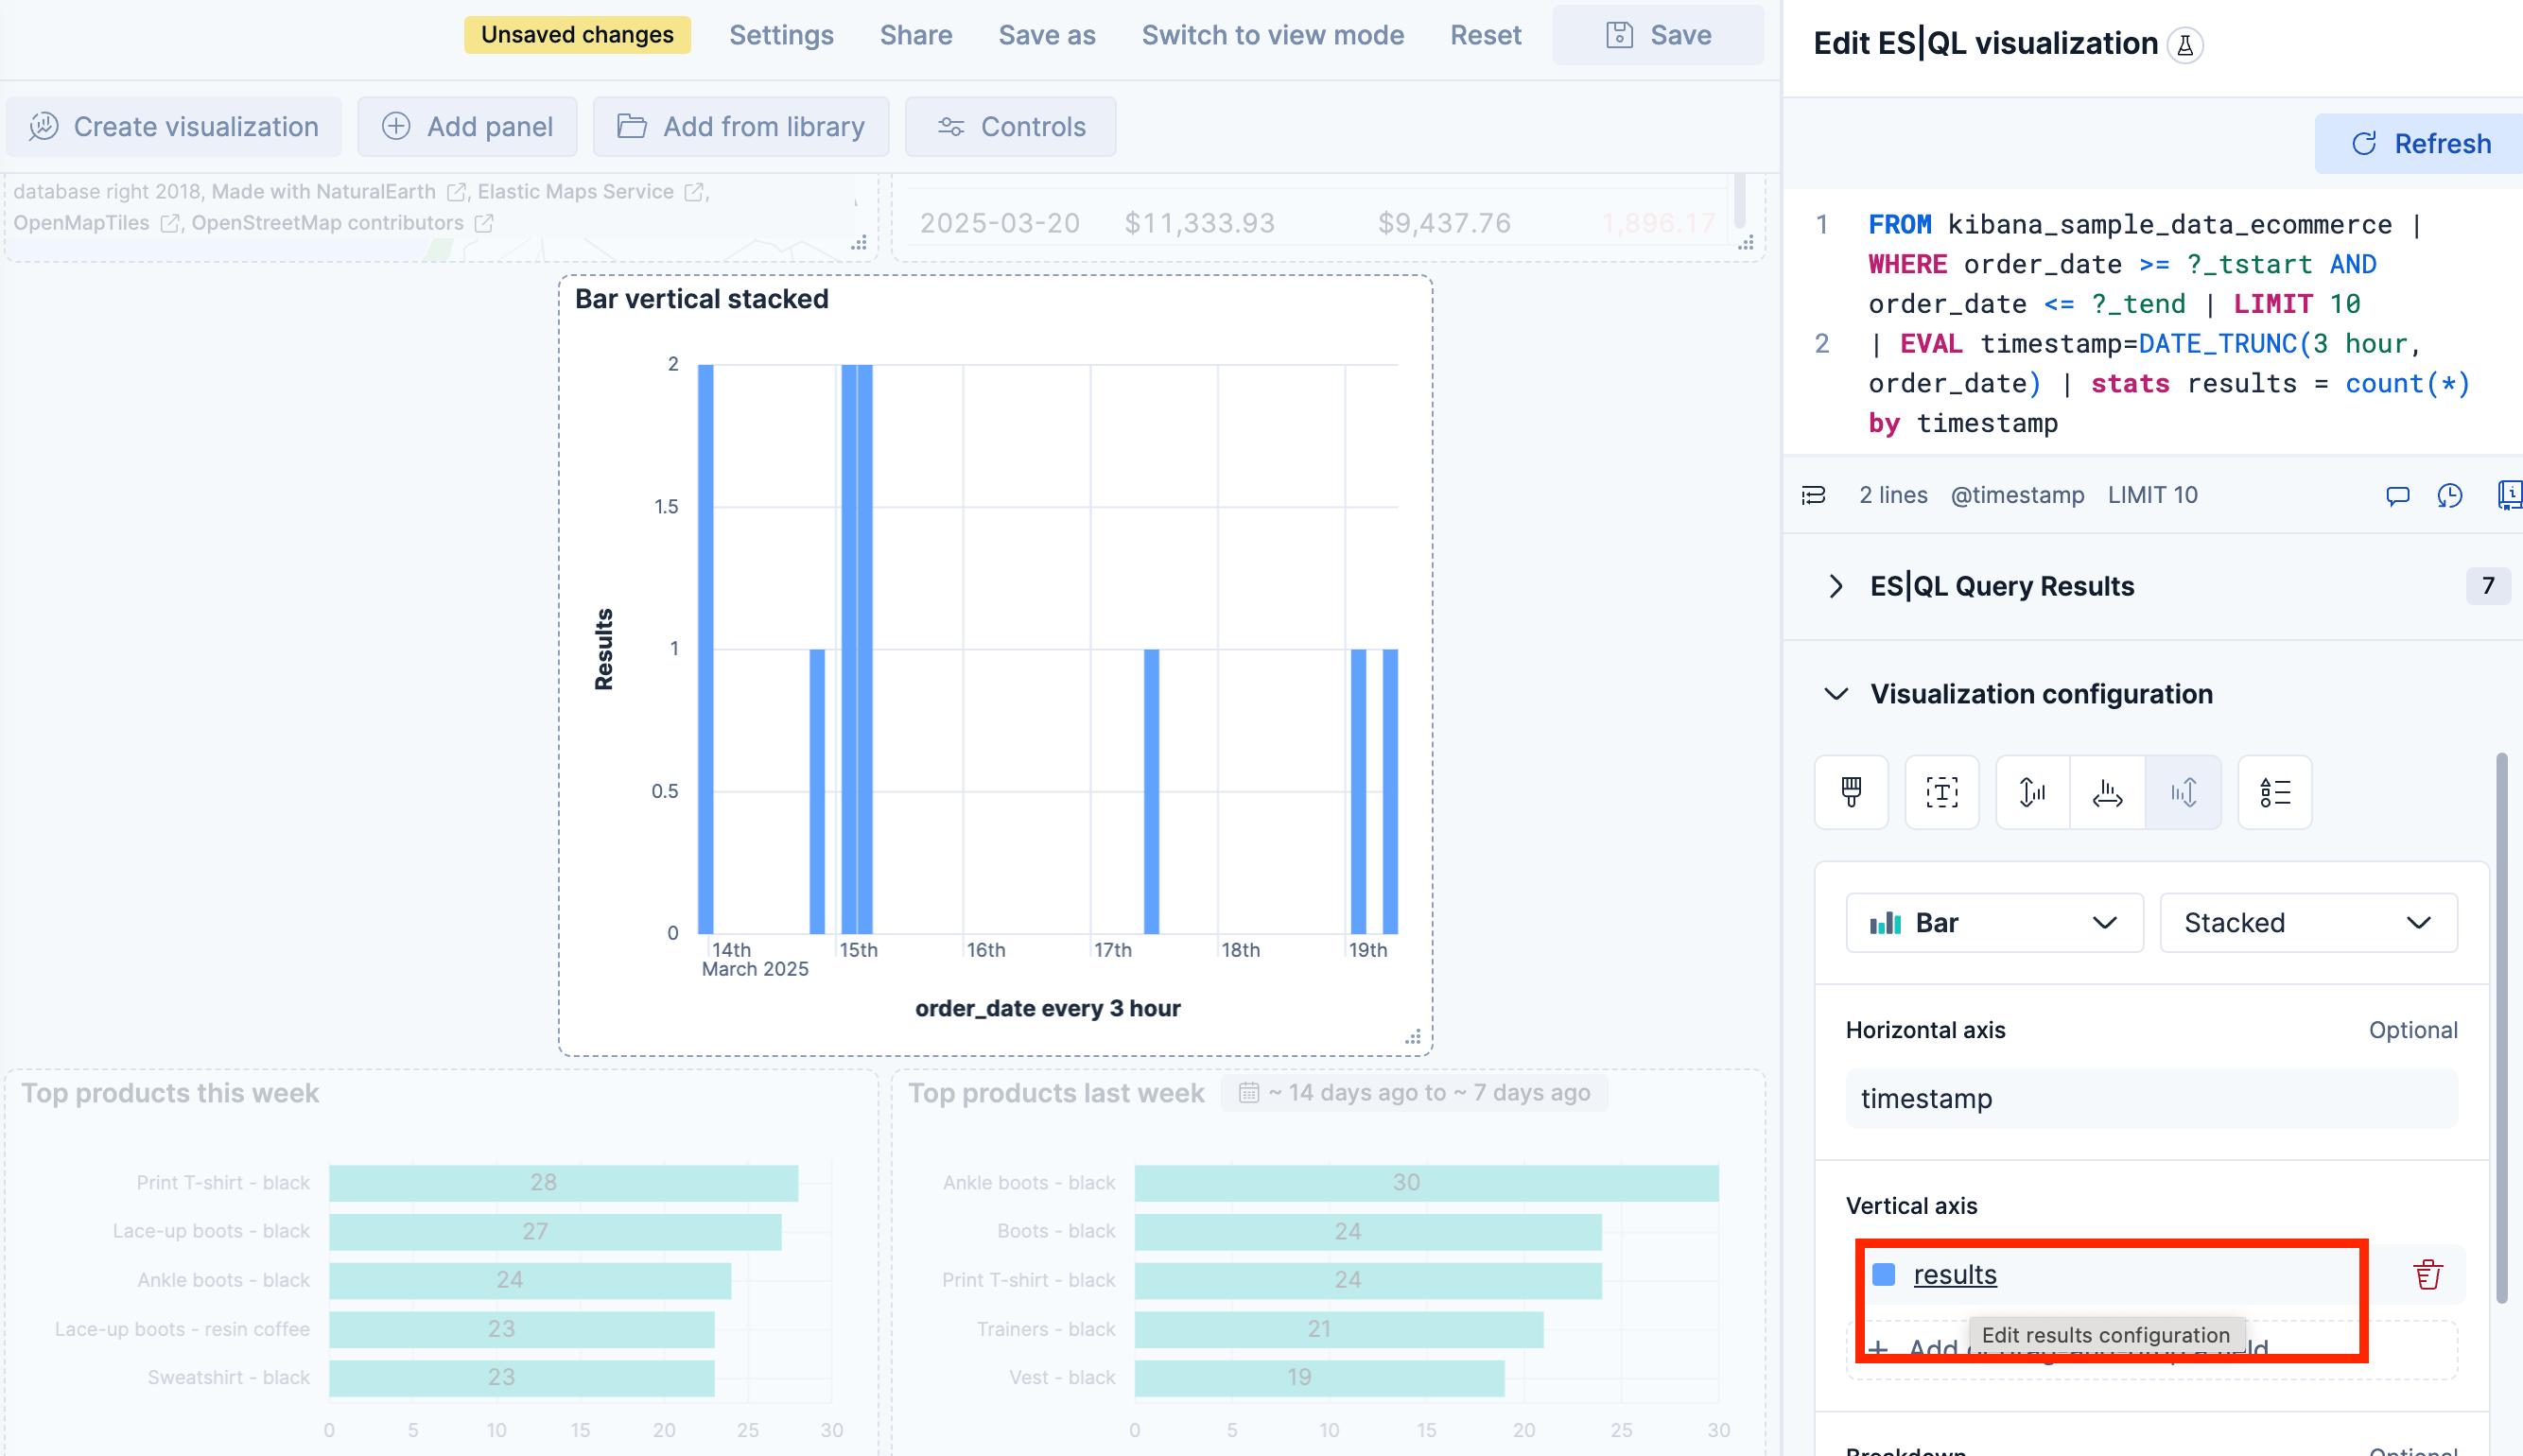
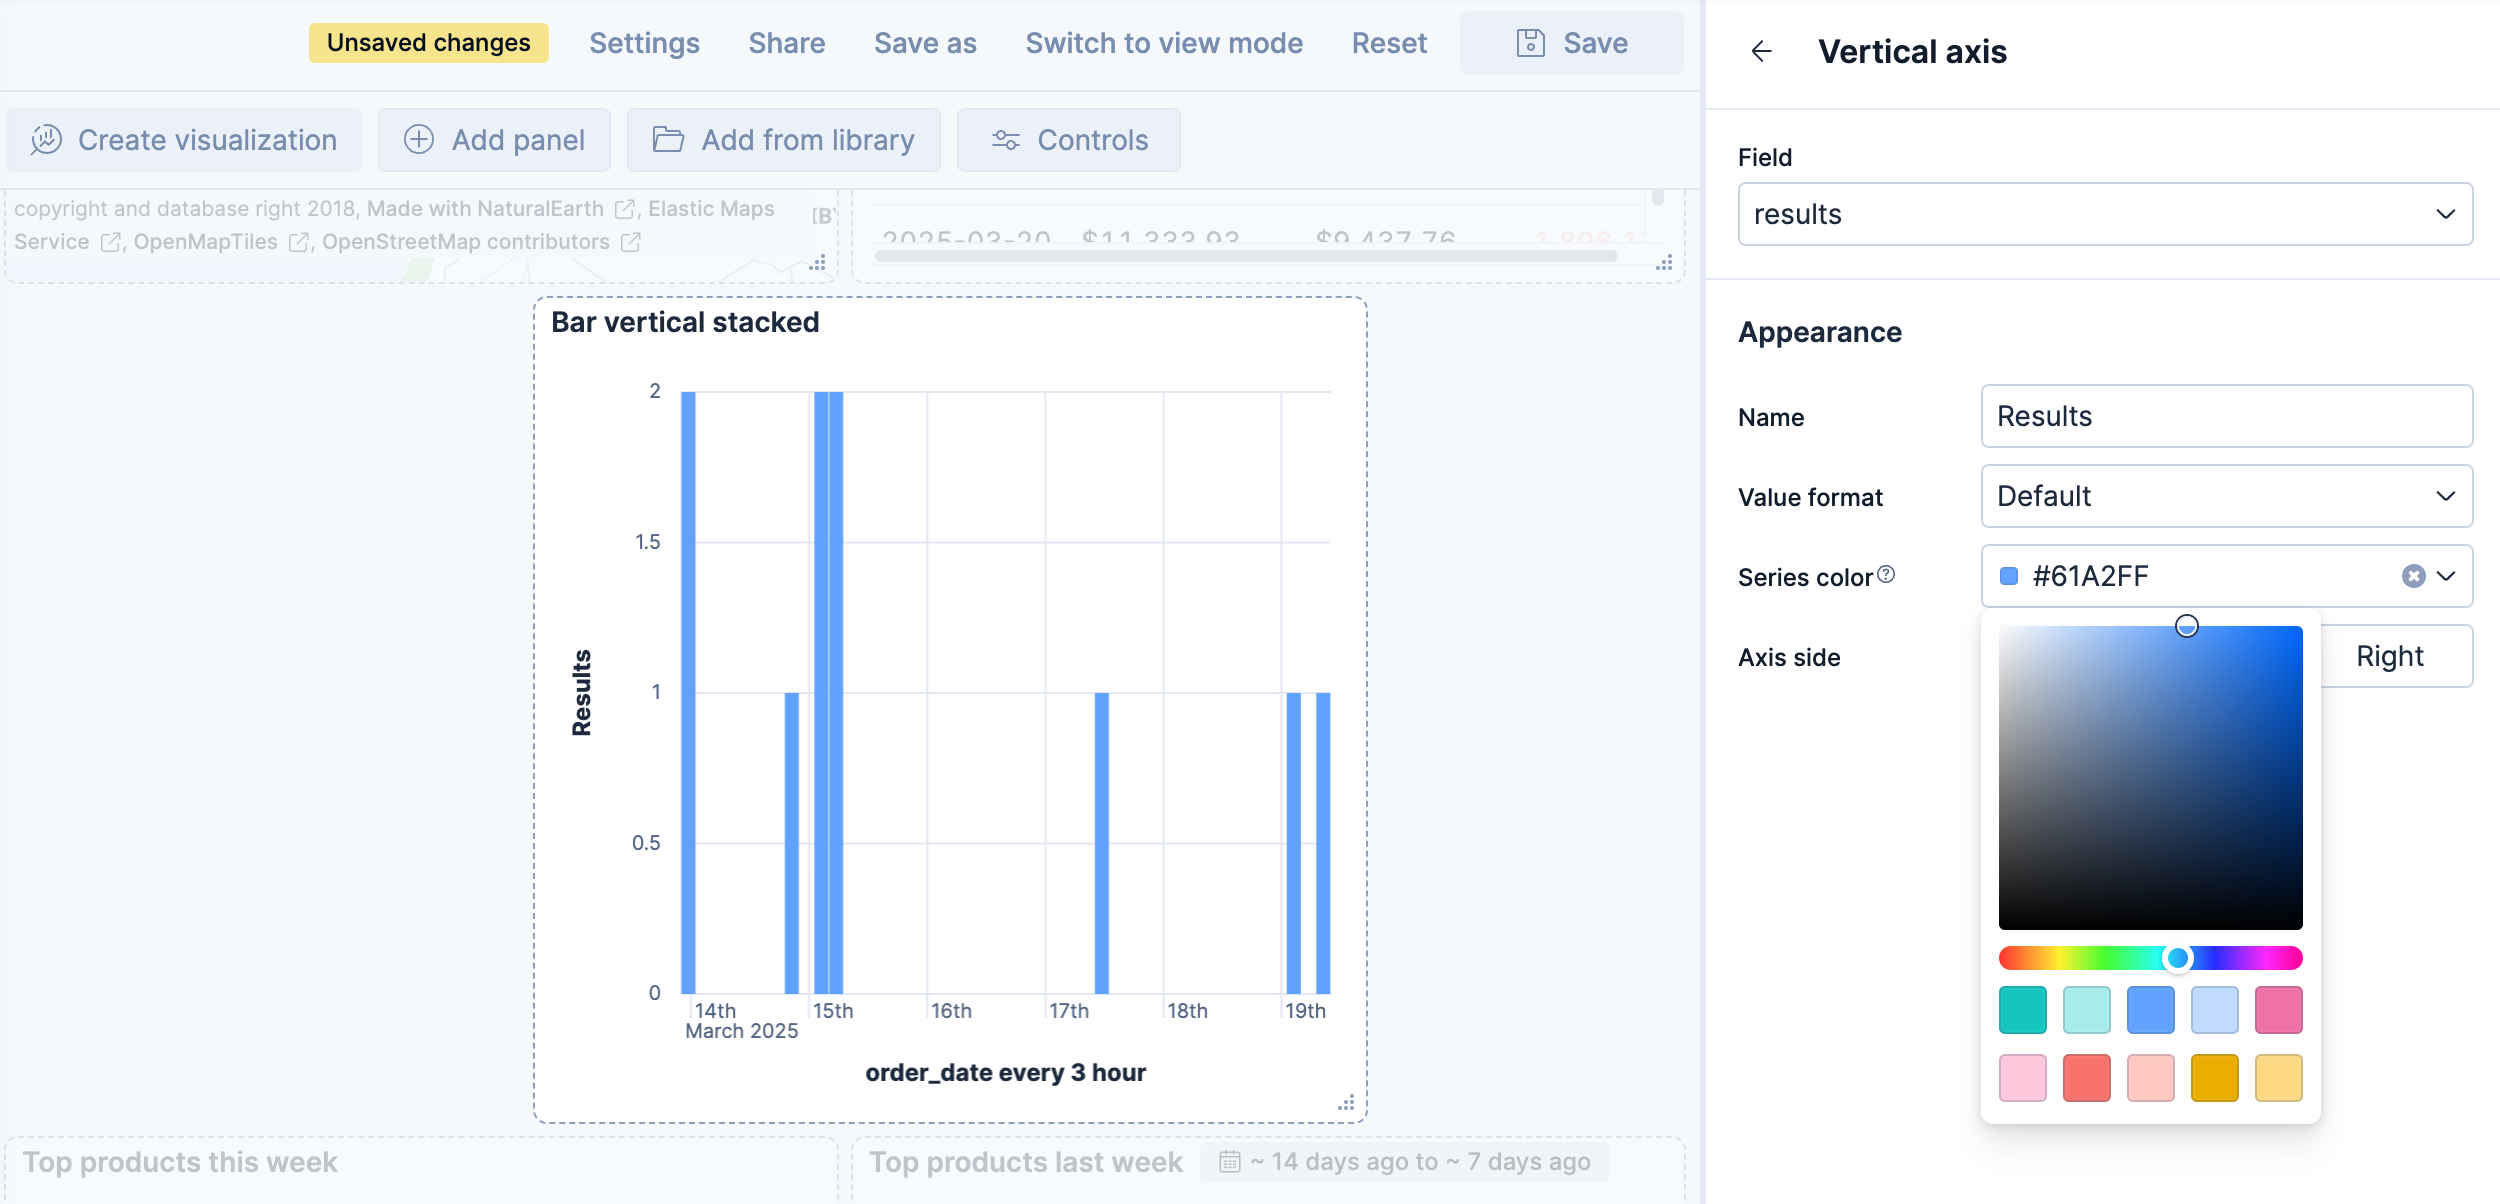
When editing an ES|QL visualization, you can customize the appearance of the chart. To do that:
Click one of the fields representing an axis of the chart to open its details.

Define the appearance of your choice from the available options.

Return to the previous menu, then Apply and close the configuration to save your changes.
Serverless Stack
When you edit the ES|QL query and run it again, the visualization configuration persists as you defined it as long as it is compatible with the query changes.
The chart configuration resets or follows automatic suggestions when:
- Stack You manually select a different chart type incompatible with the one previously selected.
- Stack You create a new chart and haven't edited the visualization's options yet.
- The query changes significantly and no longer returns compatible columns.
Serverless Elasticsearch Serverless Observability Serverless Security Stack
Once you've created an ES|QL panel, you can create an Elasticsearch threshold rule directly from the visualization panel, based on the data it displays. When you do this, the rule query is automatically generated and either describes the data and sets a specific threshold, or describes the data without setting a specific threshold.
Elastic Security rule types are not supported.
To create a rule with the threshold pre-specified:
- Right-click a data point in the visualization and click Add alert rule. This opens the Create rule flyout. The generated query will define a threshold that corresponds to the data point you selected.
- Configure your Elasticsearch rule.
To create a rule without the threshold pre-specified:
- Open the More actions (three dots) menu in the upper right of the panel and select Add alert rule. This opens the Create rule flyout. The generated query will define a threshold that corresponds to the data point you selected.
- Configure your Elasticsearch rule.